Watch my presentation of the Top 2000 jumpchart, held on the Virtual User Group meeting on May 27th 2020:


Antichaos
Data Visualisation, Tableau & Data Services
Watch my presentation of the Top 2000 jumpchart, held on the Virtual User Group meeting on May 27th 2020:
Many people are kind of scared of using programming language. And sure, if you haven’t any experience using these ‘command line’ tools the learning curve may seem steep. And why should you learn a language like Python, if you have a fantastic tool like Alteryx to process your data?

In my annual exercise of visualizing the Dutch Top 2000 I made use of a couple new Tableau tricks, like navigation buttons (a lot of work to create the on all dashboards, but well worth it) and transparent sheets:
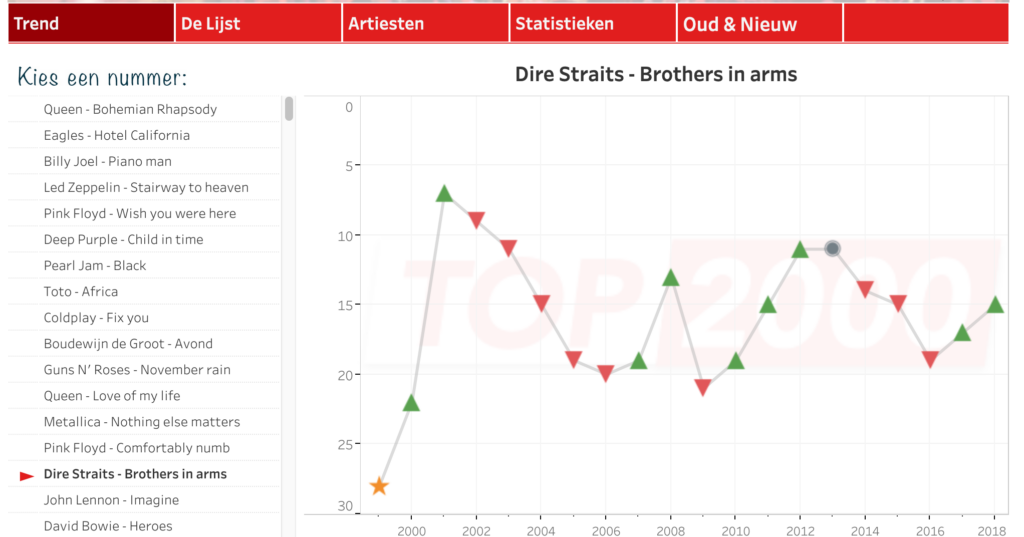
Tableau can handle all kind of dates and dateformats very well – but one option is lacking: the use of ISO8601 weeknumbers, the one which is used all over the world, especially in Europe.

Sometimes you need to calculate how many days a certain month – like the current month. With some nested date-calculations this isn’t that hard to calculate…