Tableau has created a nice blog post on Tableau Forum Ambassadors. It describes what these ambassadors do, how they can be used on the Tableau journey,
[Read more…] about Featured Forum AmbassadorFeatured
Tableau’s Order of Operations
The order of operations in Tableau refers to the sequence in which the software processes the data and calculations in a given worksheet or visualization.
The order of operations in Tableau is the order in which Tableau performs its various actions. An action is mostly identified as a filter, but can also be a calculation or another Tableau feature which is computed.
This is Tableau’s Order of Operations:
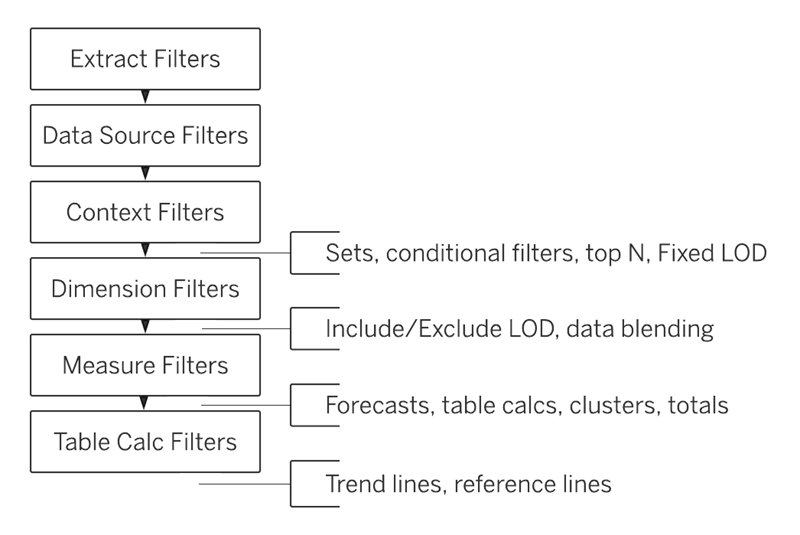
It shows in which sequence filters are handled with by Tableau: first extract filters, than datasource, context, dimension, measure and table calculation filters.
The ‘inserts’ on the right are calculations themselves.
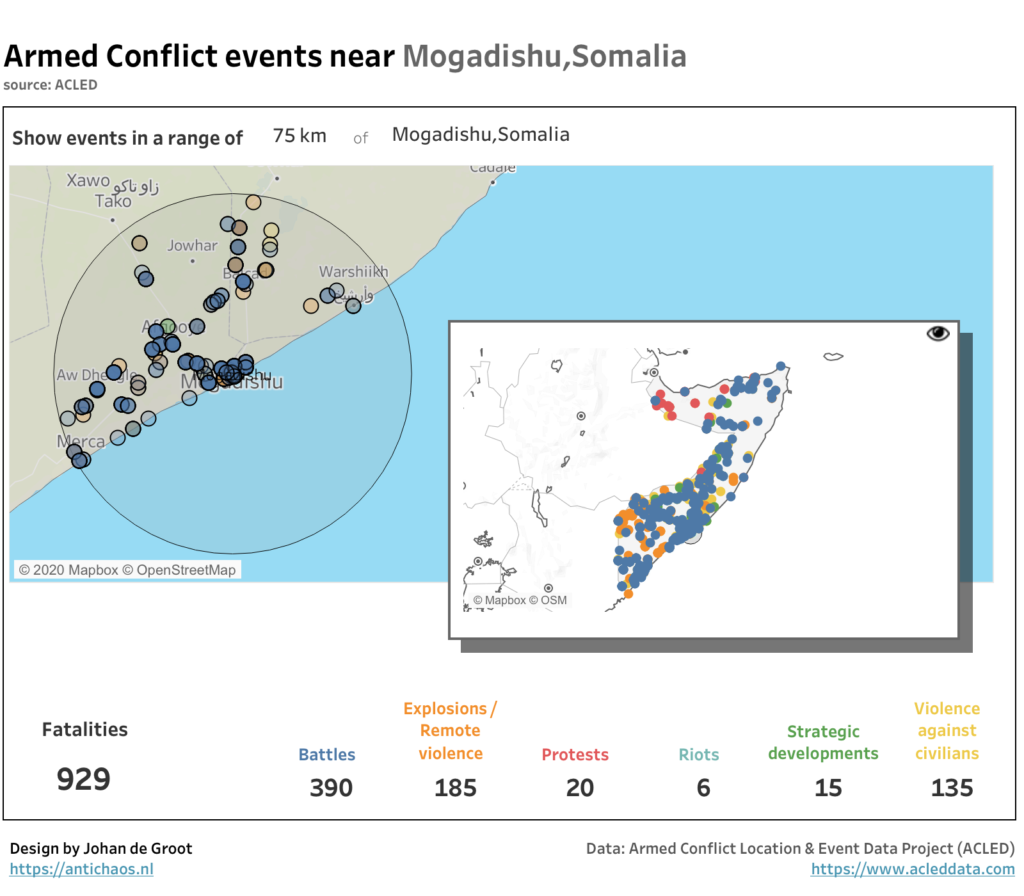
Map Layers in Tableau – step by step (or layer by layer)
The Tableau 2020.4 release comes fully-loaded with tons of great features, including several key updates to boost your geospatial analysis. In particular, the new multiple marks layers feature lets you add an unlimited number of layers to the map. This means you can visualize multiple sets of location data in context of one another, and there’s no need for external tools to build custom background maps.