• Skip to primary navigation
  • Skip to main content
  • Skip to primary sidebar
Antichaos

Antichaos

Data Visualisation, Tableau & Data Services

  • Home
  • Blog
  • Services
  • Training
  • Portfolio
  • Contact
  • Nederlands
  • Show Search
Hide Search

Formatting

Improve layout of percentags – Better labels in Tableau

2023-11-21 by Johan de Groot

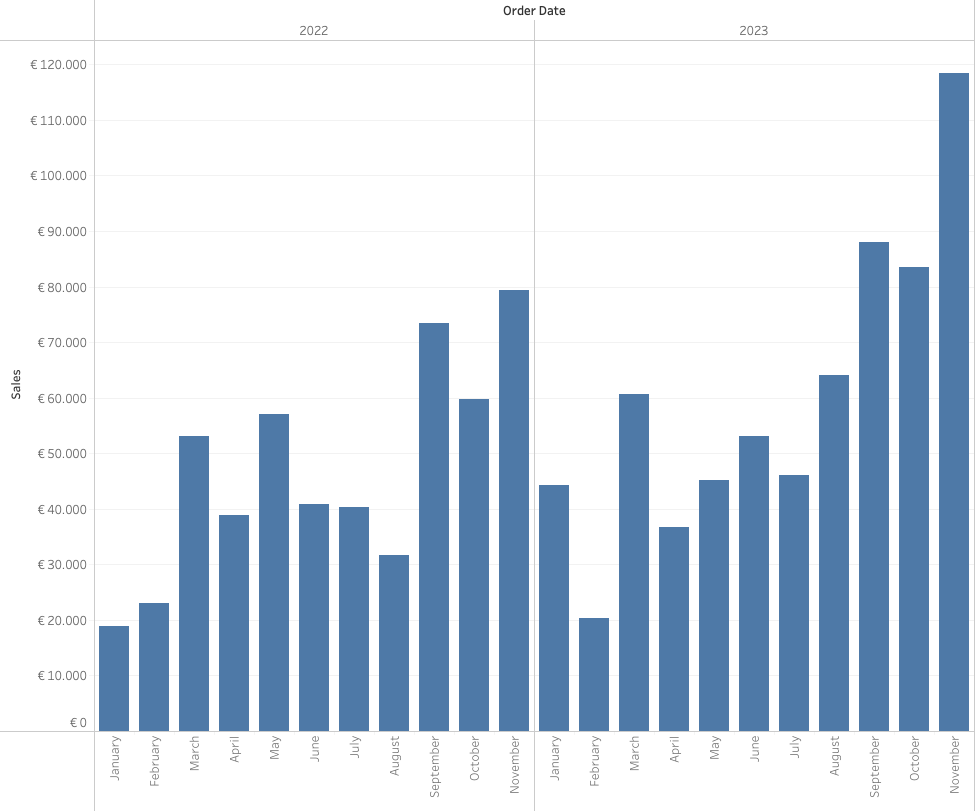
Often improving a dashboard is about small changes. Have a look a this chart:

[This blogpost is part of a series tips tricks, as being presented at VizIt Berlin 2023]

[Read more…] about Improve layout of percentags – Better labels in Tableau
  • « Go to Previous Page
  • Page 1
  • Page 2

Primary Sidebar

Antichaos Services

  • Need Tableau Help ?
  • Basic, Advanced and Custom Training

Recent Blogposts

  • Smarter dashboard design – with fewer tooltips
  • Top 2000 in Perspective – Behind the Scenes
  • How to Visualize High-Value Metrics in Tableau Without Starting at Zero
  • Why is COUNTD so slow – and how can I fix this?
  • Visualizing ‘Dynamic’ Data using a Sine Wave
  • Add ‘All’ and more options to a Dynamic Parameter
  • Tableau Container Art – 4 examples of formatting dashboards without images
  • Letting Users Choose Their Visual
  • The Tableau VizQL Data Service: What It Is, What It Can Do, and When to Use It
  • Abbreviate long text in Tableau

Antichaos

Copyright © 2026 Antichaos

  • Antichaos
  • Privacy
  • Contact