• Skip to primary navigation
  • Skip to main content
  • Skip to primary sidebar
Antichaos

Antichaos

Data Visualisation, Tableau & Data Services

  • Home
  • Blog
  • Services
  • Training
  • Portfolio
  • Contact
  • Nederlands
  • Show Search
Hide Search
Home » Blog

Blog

Tableau Ambassador 2023-2024

2023-09-07 by Johan de Groot

For the third year in a row I have been selected Tableau Forum Ambassador.

[Read more…] about Tableau Ambassador 2023-2024

Tableau User Group 2023Q1: The  Learning Path of Tableau

2023-03-01 by Johan de Groot

On the 27th of February the Tableau User Group Netherlands organized – together with the Data + Women Netherlands Tableau User Group – the first meeting of 2023. It was a very nice meetup with a perfect reception from Randstad, and two interesting talks:

  • The  Learning Path of Tableau (Randstad)
    Liezl Brouckaert & Alina Cristea
    Providing your Tableau creators with a clear personal development pathway to becoming Tableau experts is crucial. Making sure the content gives them the skills they need to unlock the value from the data is vital. But … how do you make sure the program lands well? How do you ensure employees remain engaged and complete the levels?
  • Tableau: New features in 2023 from Tableau 
    Rick Meijvogel
    Showcasing all the new and hot features in the new release also inspired by the Tableau community. 

Watch the Tableau User Group session from the 27th of February:

Better datefilters in Tableau

2023-01-22 by Johan de Groot

Datefilters are one of the most common filters on any dashboard. They are needed to see trends, make decisions on the right period, and analyse within the right context. But most of the times these filters are not optimal – so let’s make them better (and prettier)

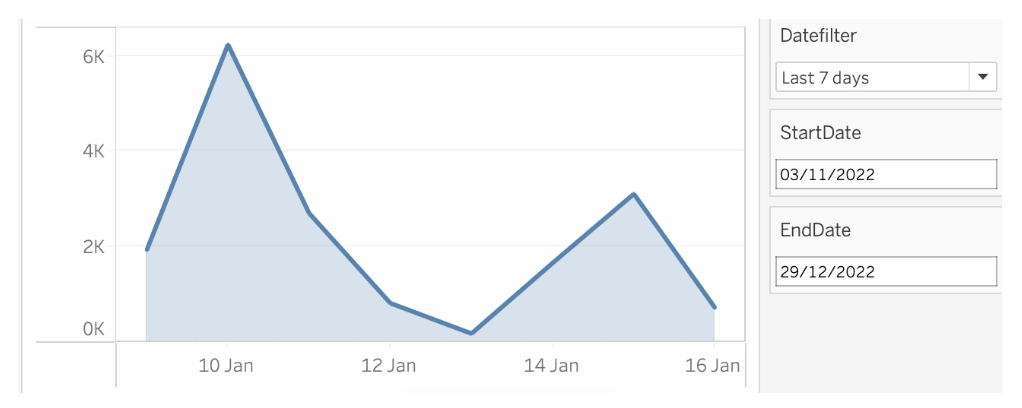
[Read more…] about Better datefilters in Tableau

The Radio Top 2000 visualised – edition 2022

2023-01-10 by Johan de Groot

I visualized the Top 2000 as broadcast by Radio 2 for the 11th time (I believe) in a different way using Tableau.

[Read more…] about The Radio Top 2000 visualised – edition 2022

De Top 2000 van 2022 gevisualiseerd

2023-01-10 by Johan de Groot

De Top 2000 zoals uitgezonden door Radio 2 heb ik gevisualiseerd met behulp van Tableau.

Dit jaar wat minder nadruk op een de vorm (hoewel ik heb gekozen voor een gedempte sinus, wat niet bepaald een veelgebruikte manier van weergeven is…).

[Read more…] about De Top 2000 van 2022 gevisualiseerd
  • « Go to Previous Page
  • Page 1
  • Interim pages omitted …
  • Page 9
  • Page 10
  • Page 11
  • Page 12
  • Page 13
  • Interim pages omitted …
  • Page 19
  • Go to Next Page »

Primary Sidebar

Antichaos Services

  • Need Tableau Help ?
  • Basic, Advanced and Custom Training

Recent Blogposts

  • Smarter dashboard design – with fewer tooltips
  • Top 2000 in Perspective – Behind the Scenes
  • How to Visualize High-Value Metrics in Tableau Without Starting at Zero
  • Why is COUNTD so slow – and how can I fix this?
  • Visualizing ‘Dynamic’ Data using a Sine Wave
  • Add ‘All’ and more options to a Dynamic Parameter
  • Tableau Container Art – 4 examples of formatting dashboards without images
  • Letting Users Choose Their Visual
  • The Tableau VizQL Data Service: What It Is, What It Can Do, and When to Use It
  • Abbreviate long text in Tableau

Antichaos

Copyright © 2026 Antichaos

  • Antichaos
  • Privacy
  • Contact