Tableau User Group Session: Insights, Fun, and Community Spirit!
What happens when you bring together passionate data enthusiasts, a relaxed atmosphere, great food, and a shared love for Tableau? You get an amazing Netherlands Tableau User Group (NLTUG) session on March 4th 2025!
Breaking the Ice – Food & Tableau Bingo!
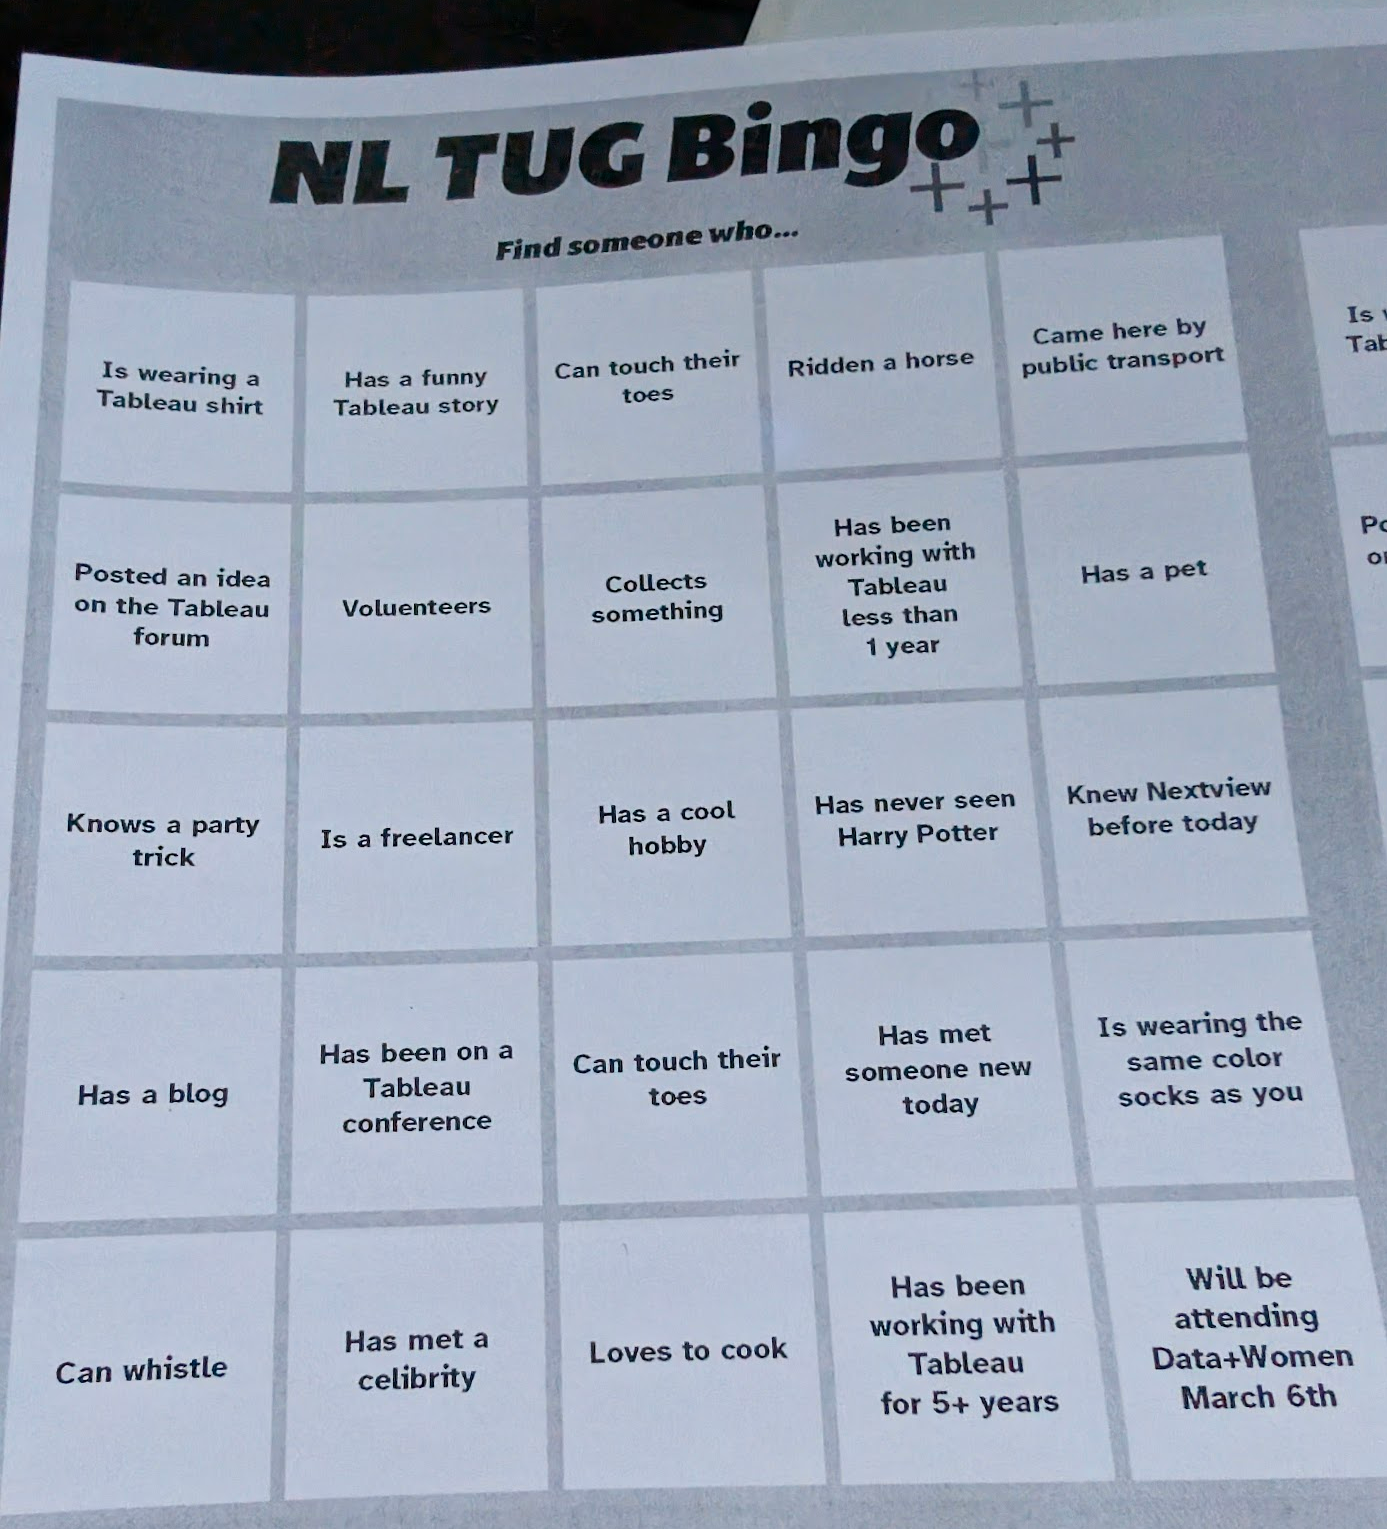
Kicking things off, we started with our own Tableau Bingo to break the ice. But our host Nextview already made the perfect ‘socializing’ move by arranging lots of great tasting food.
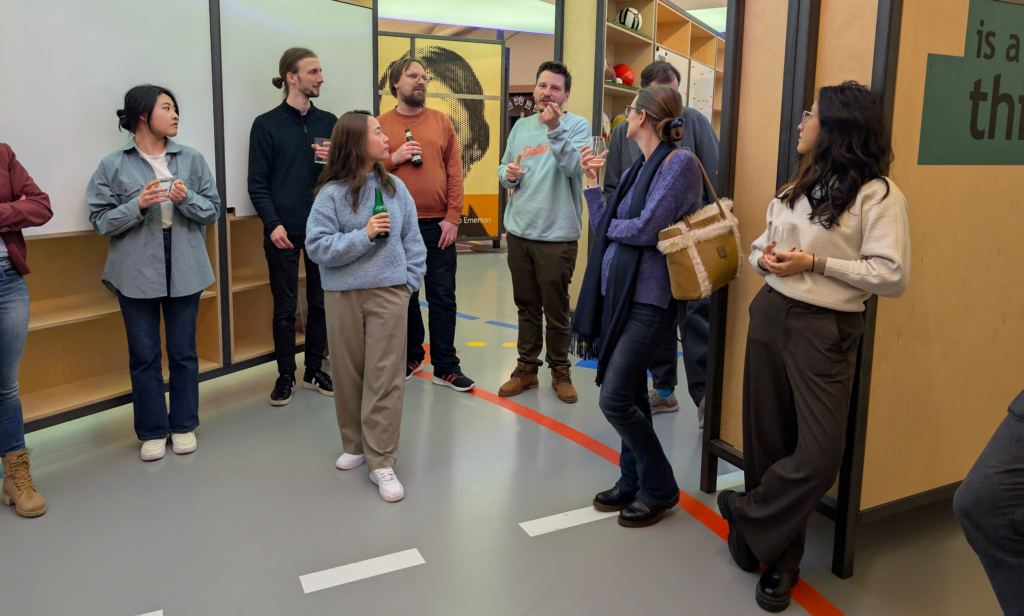
Although the number of attendees was not very large, the room was buzzing with discussions, laughter, and shared Tableau experiences.
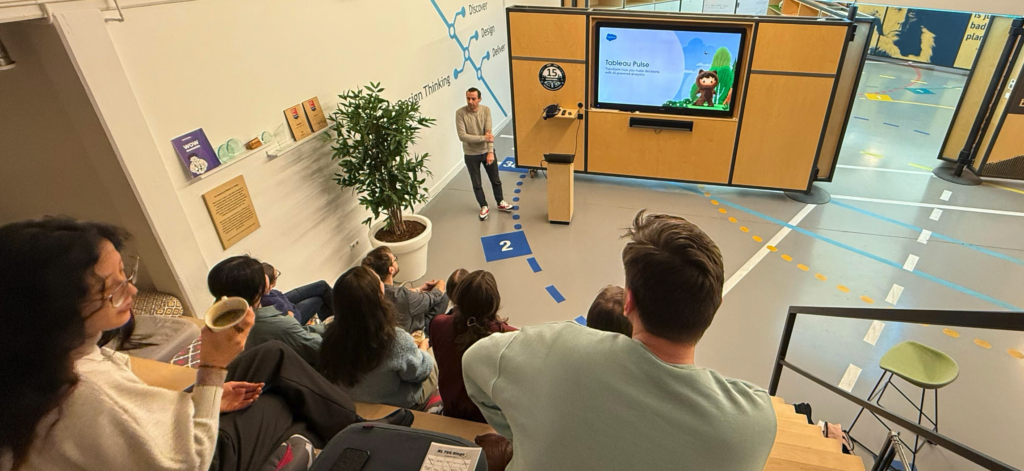
A Deep Dive into Tableau’s Future
Rick Meijvogel (Solution Engineer @ Tableau / Salesforce) took us on a journey into Tableau Pulse. Rick gave valuable insights on AI within Tableau from the early beginnings to the near future, so from Data Stories to Tableau Next.
Since this is an important topic – which hasn’t been thoroughly investigated (yet) by many – it was an eye-opening talk, filled with valuable insights and a glimpse of what’s next (pun intended).
His presentation took over an hour – but even after 8 o’clock in the evening everyone stayed for the next part,
Doctor Session – Ask, Learn, Win!
We wrapped up with a Community Doctor Session, where attendees could ask their burning Tableau questions, in exchange for a shot at some cool swag. Everyone jumped in to help each other out, creating a dynamic and engaging problem-solving environment.
The most voted up questions were:
- How can I remove the ‘abc’ in a table?
- I need help with building Sankey Charts on Tableau
- A better way to copy and paste values from a dashboard
- How can I export a graph as SVG?
- How to filter datefield – most recent op top?
- Advice on better/efficiently. managing permissions
- What is VizQL?
Thank you!
A huge thank you to everyone who joined this session! Your enthusiasm, curiosity, and willingness to share knowledge made this event truly special.
A big shoutout to Nextview for hosting and providing great food, and to Rick for the inspiring presentation. We’re already looking forward to the next session—see you there! 🚀
Join the NLTUG to keep up to date:
https://usergroups.tableau.com/netherlands-tableau-user-group