With Tableau 2026.1, a major new feature has arrived. You can now bring fresh, live data from web services directly into your dashboards – no scripts, no intermediate databases, and no manual imports required.
Whether you want to monitor the latest sales from your CRM, track website visits in near real-time, or display the current weather for operational planning, the REST API Connector makes it simple to integrate external data into Tableau Server or Tableau Cloud.
This feature is particularly useful for analysts who need near‑real‑time operational data (CRM updates, event logs, weather, IoT signals) without traditional ETL workflows.
What is an “REST API”?
The abbreviation stands for REpresentational State Transfer Application Programming Interface – so forget this right away.
Simply put, a REST API is a way for different software systems to talk to each other over the web. It lets one application request data (or trigger actions) from another application using standard web protocols.
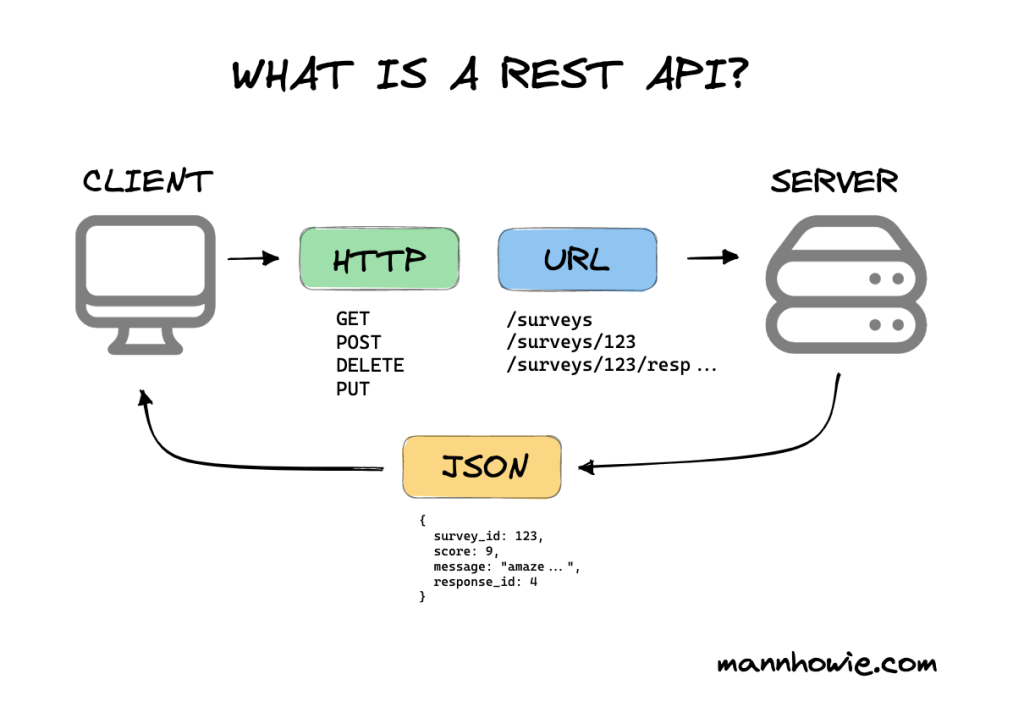
While the overall protocol is well defined, the details can vary between systems. Requests can be tricky because of things like authentication, paging, or rate limits, and the responses can come in many formats – though JSON is by far the most common.
REST API Connector for Tableau
Until now, this was usually handled with scripting. For example, a Python script would call the API, retrieve the data, and store it in a database that Tableau could then connect to.
With the new feature in Tableau, it’s now possible to fetch data directly from a web service into Tableau Server or Tableau Cloud. This means the data can be used in dashboards without needing an intermediate script or database layer.
Why Most REST APIs Return ‘Recent’ Data, Not Full History
The purpose of most REST data APIs is to provide recent or operational data, rather than the entire historical dataset. They are typically designed to return the latest information from a system.
For example, an API might return:
- the most recent customers added in a CRM system
- the latest orders or recently sold products from an e-commerce platform
- yesterday’s website visits from a web analytics tool
- the current GPS location of delivery trucks in a logistics system
- the latest weather forecast or current conditions
These types of APIs are optimized for accessing fresh data on demand, which makes them useful for dashboards in tools like Tableau that need to show near-real-time operational insights rather than full historical data loads.
If full data is needed, other methods are often available like datadumps.
Tableau REST API Connector in practice: an example
Tableau Desktop doesn’t yet include the connector UI (to some confusion…), but you can still build and test API connections via Server/Cloud and develop locally.
Before You Begin
Before connecting a REST API to Tableau, make sure you have a few essentials in place:
- API Key or Credentials: Many APIs require authentication. Register with the service and get your key.
- API Endpoint: Know the URL you’ll be calling to fetch the data.
- JSON Explorer or Viewer (optional): Helpful to inspect the structure of the API response and identify which parts you want to extract. A webbrowser can also be used as a viewer.
- Access to Tableau Cloud or Server: The REST API Connector is currently available only in Tableau Cloud or Server (not yet in Desktop).
- Basic understanding of JSON Path: To extract the specific part of the API response you need for your dashboard.
Having these ready will make connecting your API and building your dashboard much smoother.
Weather Forecast Example with OpenWeatherMap
To illustrate how to set up a simple REST API call in Tableau, let’s use the OpenWeatherMap (OWM) API. OWM provides a well-documented API that allows you to download the most recent weather forecast for any location on Earth. The service is free as long as you don’t exceed roughly 2,000 requests per day.
Once you register, you can subscribe to the OneCall API, which provides detailed weather information for today and the next 10 days. Using an API key (which acts like a password), you can fetch weather data with a URL like this:
https://api.openweathermap.org/data/3.0/onecall?lat=LATITUDE&lon=LONGITUDE&appid=APIKEY
For example, the San Diego Convention Center—home of the Tableau Conference—has these coordinates:
Latitude: 32.7056421195786
Longitude: -117.1598023952318
Plugging them into the URL gives:
https://api.openweathermap.org/data/3.0/onecall?lat=32.7056421195786&lon=-117.1598023952318&appid=YOUR_API_KEY(Replace YOUR_API_KEY with your own secret API key.)
You can test that your setup works by opening this URL in a browser. If everything is correct, you’ll see the weather data returned in JSON format:
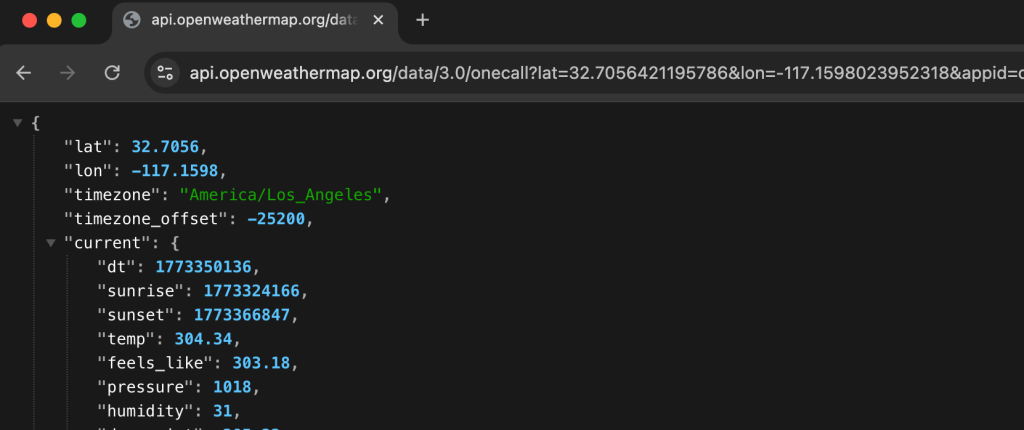
In our dashboard we are going to use the ‘daily’ part of the response, with the weatherforecast for the next 10 days.
Connecting the API to Tableau
Setting up the parameters and authentication for a REST API is often the trickiest part – but once it’s done, Tableau makes the rest straightforward.
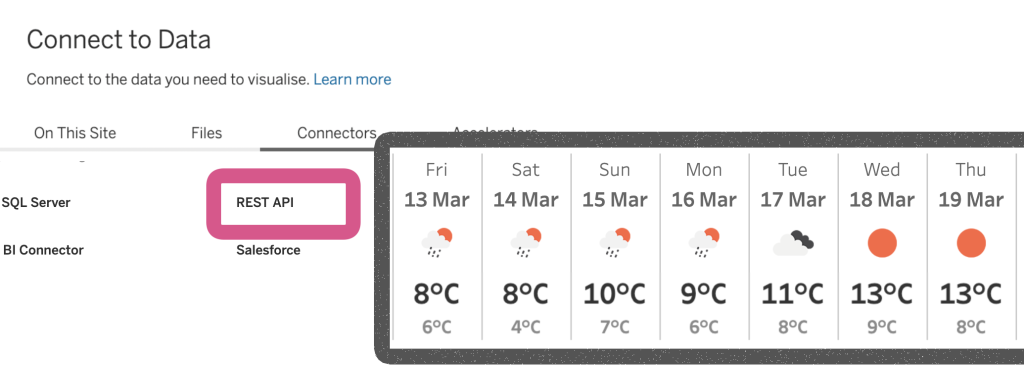
1. In Tableau Cloud or Server go to ‘New’ > ‘Published Data Source’ from the Explore section. Then select ‘REST API’ under the Connectors tab.
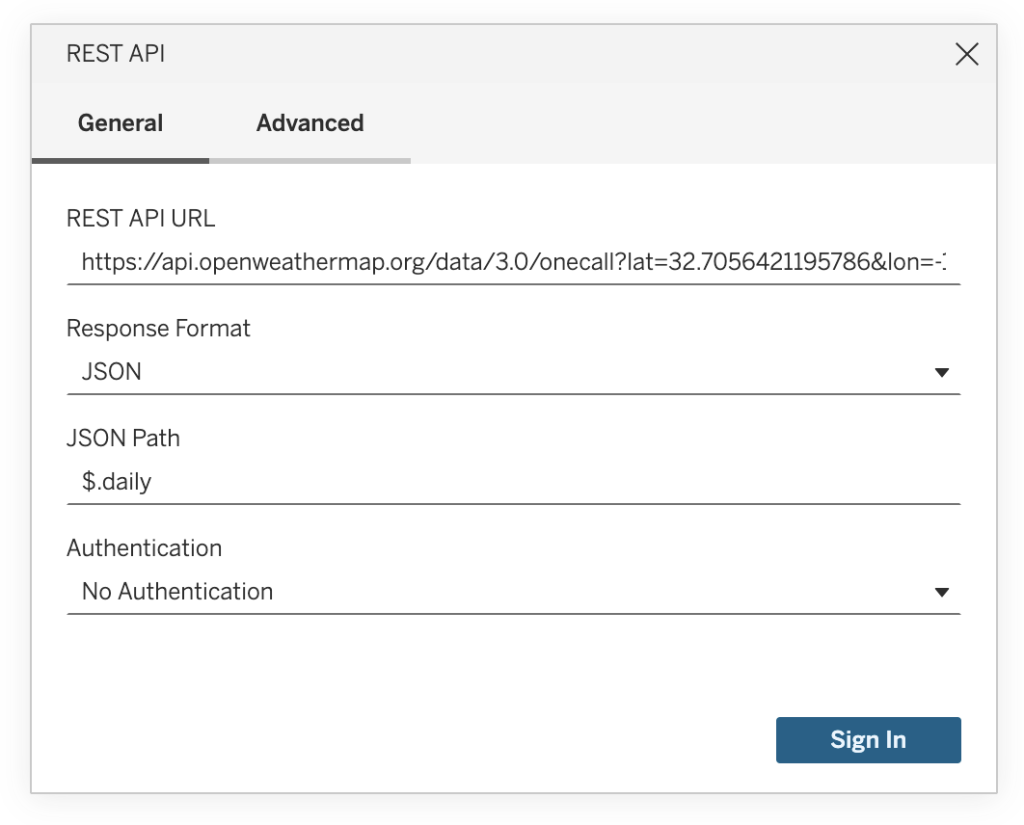
2. The connector offers many configuration options under General and even more under Advanced. For this example, we’ll keep it simple:
- REST API URL: paste the URL you constructed earlier
- Response Format: JSON
- JSON Path:
$.daily
(it lets you extract only the part of the response you need (e.g., daily forecast), reducing unnecessary data load and avoiding difficult data transformations) - Authentication: None (but check the options if you’re connecting to a secured API)
3. You don’t need to change anything under Advanced, but giving your Tableau Table Name a more descriptive name than the default rest_table is a good idea.
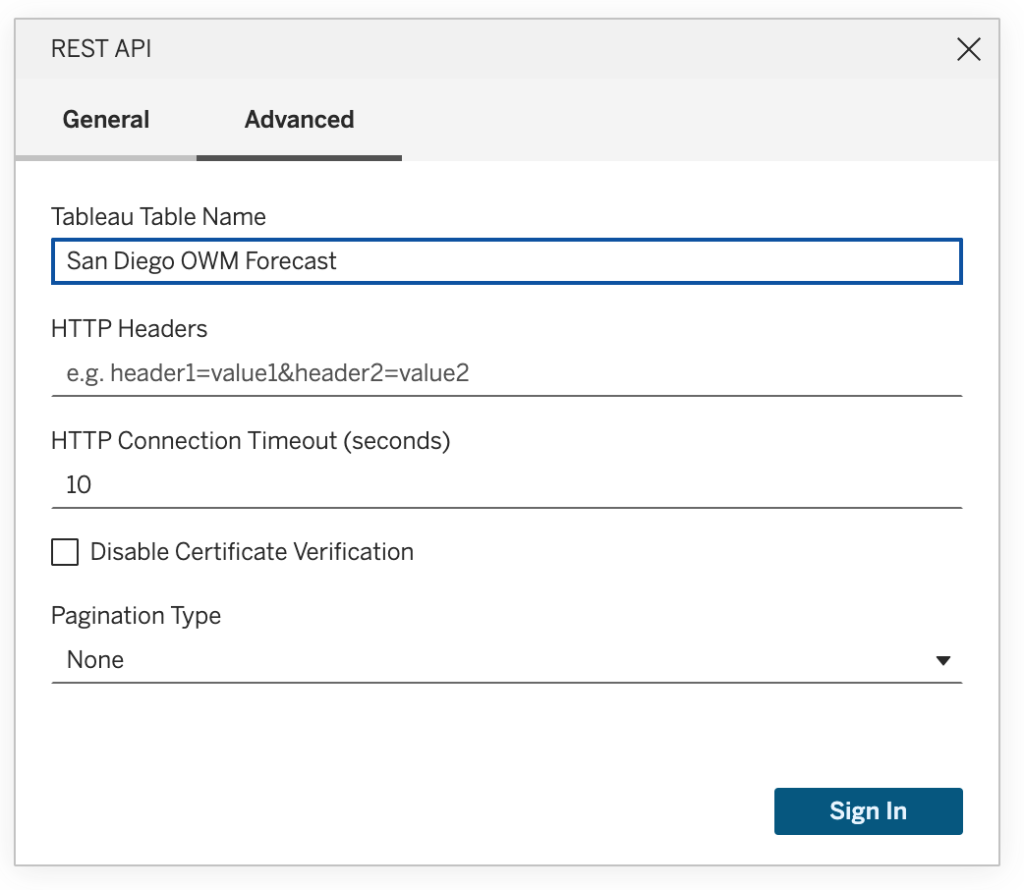
j4. Click Sign In. The window will close, and Tableau will show a preview of the data format.
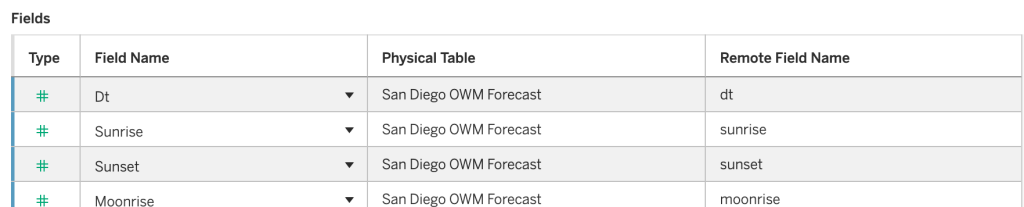
5. If you’re happy with the columns, click ‘Publish As…’. Tableau Cloud or Server will fetch the data as an extract, and you can give your new data source a meaningful name.
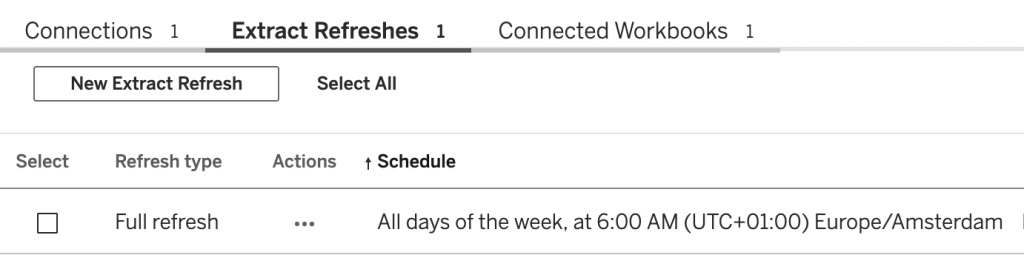
6. Schedule the Extract Refresh: set it to run every morning at 6:00. This ensures the data in Tableau is always up-to-date using the OpenWeatherMap API.
Creating a workbook using the Datasource
In Tableau Desktop (or in Tableau Cloud/Server using Web Edit), create a new workbook and connect to the published Tableau Server data source you just created. From there, you can build a worksheet visualizing the weather forecast data.

This is exactly what makes the new REST API Connector so powerful: you can quickly add fresh, external data to your dashboards—no complex scripting, database management, or manual imports required.
For example, a small forecast widget can enhance dashboards for:
- Retail planning: anticipate how weather might affect store visits
- Logistics: adjust delivery schedules for rain or snow
- Marketing: time promotions or campaigns based on customer behavior patterns
And the best part? Everything updates automatically via the REST API, keeping your dashboards current with minimal effort.
Conclusion and Alternatives
The REST API Connector puts live, external data right at your fingertips in Tableau It’s ideal for dashboards that need fresh, operational insights, from recent sales and website traffic to weather forecasts or delivery updates.
However, there are still scenarios where other approaches may be better:
- Full historical data or large datasets
Traditional extracts and database connections are still the way to go. - True real-time data: If you need second-by-second updates, a table connector table connector using an external Python script may be more suitable.
- Complicated JSON formats: When the API returns deeply nested or complex JSON, downloading and transforming the data externally (e.g., with Python) can give you more flexibility before connecting to Tableau.
The new REST API Connector complements these solutions perfectly, providing a lightweight, easy-to-use option for bringing up-to-date web data directly into your dashboards.