
A while back I introduced a little Tableau extension I built called CountTo – a number that animates up (and down) to your KPI instead of just sitting there. It started as a client request for a sustainability dashboard, turned into a fun JavaScript challenge, and ended up being one of the more popular things I’ve put out for free.
I have revamped it – new name, same idea, a lot more polish. It is now called Tally.
Why the new name?
The problem is that “CountTo” sounds like a function in a calculated field or SQL: a mechanism, not a name. So I gave it a name that belongs to a family of extensions which will be released soon, like Ticker, Fanfare, Gazette, Quilt and Crossover.
“Tally” – to count, to keep score.
The original CountTo is still there if you’re already using it; nothing breaks. But everything new goes into Tally.
So what does it actually do?
Same as before: drop a single measure onto the extension and the number counts up from zero when the dashboard loads.
And when the data changes – Tally re-counts. Flick a filter, switch a parameter, change the date range – and the number animates from its old value to its new one, pulling the eye to the number that matters.
Try it for yourself in this demo below (the extension itself has many more options)
Partly gimmick, genuinely useful as a focus point.
What’s kept and what’s new?
When rebuilding, I took the chance to fix some stuff, without omitting previous functionality.
- Real-time preview. Adjust anything and the sheet updates instantly, so you can dial it in by eye.
- A proper config screen. Settings are now grouped – Number, Appearance, and Animation instead of one long list of options – and it also looks much smoother.
- Number formatting that handles real-world KPIs. Decimals, thousands separators in your locale, percentages, a prefix and suffix (so $, €, %, “orders” all just work), and abbreviations: turn 12,480,000 into tidy 12.48M (while we are waiting until Tableau implements this natively).
- Full control over the look. Font type, size, alignment, and plenty more… All real-time adjustable, so you can see what each setting changes.
- Animation you control. Speed and easing, so the count can be a snappy tick or a slow, dramatic climb.
- Copy the settings to a new instance. If you want to create similar-looking BANs for Sales, Quantity and Profit, the settings can be copied over easily.
Getting it onto your dashboard
It is easy to use it – just like other viz extensions.
- Download the extension file: extensions.byantichaos.com/Tally/tally.trex
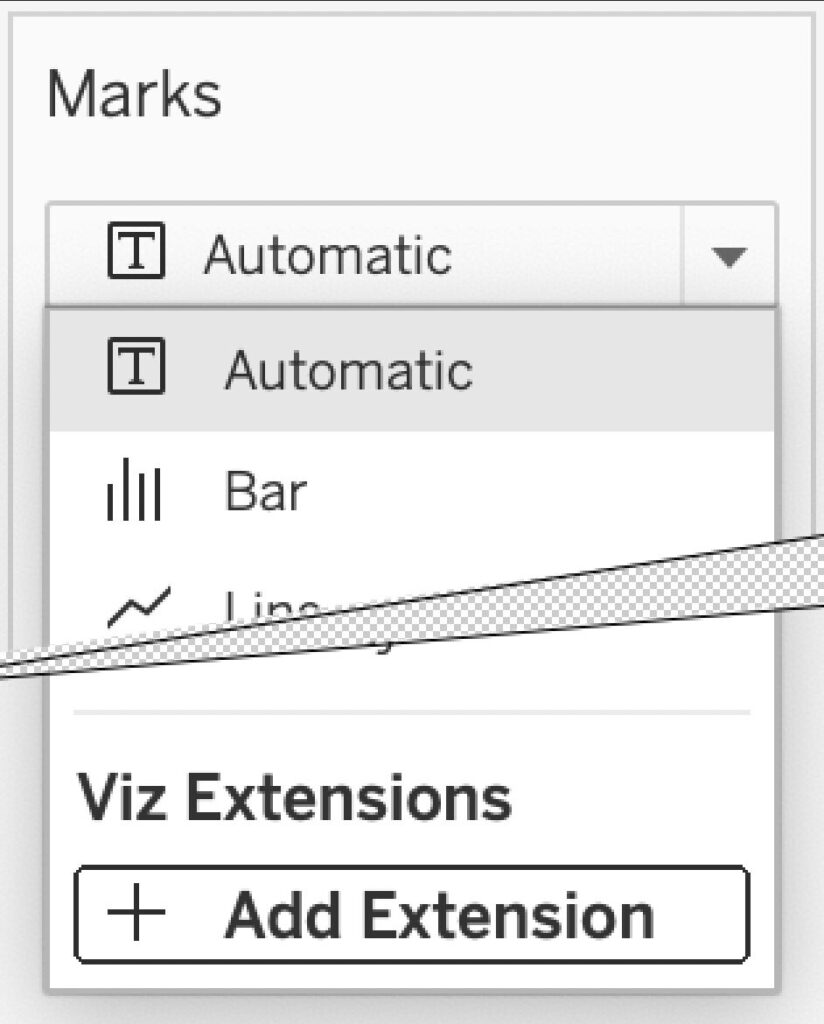
- Create a new sheet in Tableau, choose Marks type Viz Extension
- Open the tally.trex file by choosing ‘Add Extension’ – ‘Access Local Viz Extensions’
- Drop one numeric measure onto it.
- Open Format Extension and make it yours — formatting, font, animation.

One small caveat that hasn’t changed: this viz extension doesn’t (yet?) run on Tableau Public, and on Tableau Server / Cloud an admin needs to whitelist the URL. On Desktop it just works.
On Tableau Server or Cloud a Tableau admin needs to add https://extensions.byantichaos.com/Tally/ to the allowed extension URL list – or add https://extensions.byantichaos.com/.* to allow all extensions from me/Antichaos.

A note on your data
Tally runs entirely in your browser. Your numbers never leave it, there’s no server crunching your KPIs, and nothing from your data or workbook gets sent to me or anyone else. The extension just reads the value from Tableau, which your browser turns into the animation.
There’s one small thing I’ll always be upfront about: Tally sends a lightweight beacon so I can tell it’s actually being used out in the wild. No numbers, nothing from your data, just a sign of life that helps me justify the evenings spent building these. It’s on by default, but if you’d rather Tally stayed completely silent, there’s an opt-out toggle right in the settings.
More to come!
Tally isn’t lonely anymore… It is the first of a shelf of free and paid Tableau extensions I have been building, each trying to do one thing very well. From gimmick (but useful) to things you probably need. Let me know if you want to know more or want to become a beta-tester, or wait just a little bit longer…
And as always…
The best ideas for these things come from the people using them. The original CountTo got better because folks told me what they wanted, and Tally is the result of that. So – same question as often: what would make this more useful to you?
Gave Tally a spin? I’d love to hear what you think: drop your feedback, feature ideas, or bug finds in the extensions form. Every bit of help counts: the best contributions earn early access to new extensions, and a free subscription to the extension you helped shape, should it launch as paid.