If you experience 502 errors when downloading large datasets from Tableau Server – either in a browser or Tableau Desktop – you might occur problems not related to Tableau Server, but a proxy or gateway in front of the server.
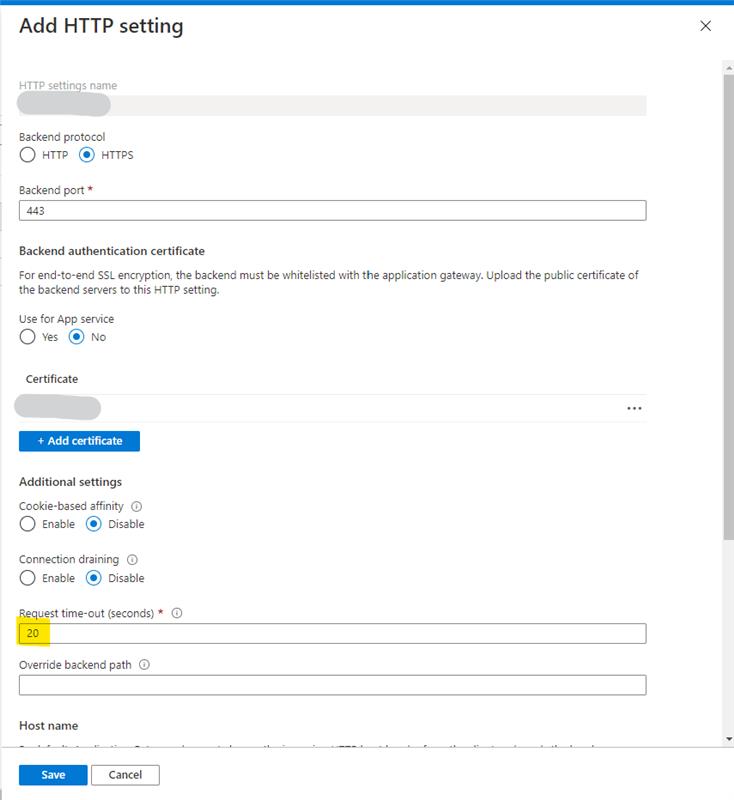
On Azure, an often used (and recommended) architecture is the use of a http gateway in front of Tableau Server. The default request timeout is set to 20 seconds, which is usually no problem for a usual website.
But if you download a large datasource Tableau first needs to ‘prepare’ the download, which can exceed these 20 seconds.
If you encounter these kind of problems, you should change the ‘Request time-out’ setting to a larger value. This figure should not be too high, but you could start by setting it to 60 seconds – if you still get these errors you can increase this further to e.g. 120 seconds.
This is probably not only applicable to Azure cloud solutions, so if you are time-out issues on your server, please check any gateways/.load balancers or proxies which might cause your problem downloading a large datasource (or workbook)