(In Dutch) Voor de editie van 2020 heb ik dit keer niet gekozen voor een extreem fancy datavisualisatie met uitgebreide data-preparatie en/of ingewikkelde wiskundige formules, maar wat meer nadruk gelegd over hoe je met relatief eenvoudige grafische elementen je een dashboard een compleet ander uiterlijk kunt geven dan een ‘standaard’ dashboard.
[Read more…] about Top 2000 visualisatie – editie 2020blog-en
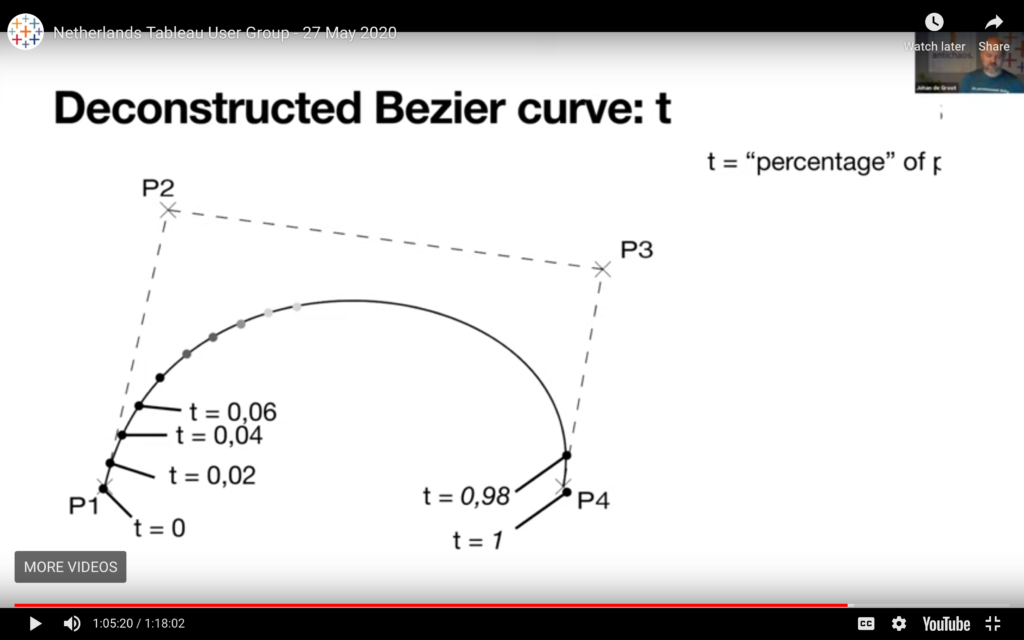
Bohemian Rhapsody: From Top 2000 to jump-chart
Watch my presentation of the Top 2000 jumpchart, held on the Virtual User Group meeting on May 27th 2020:
Use Python as an Alteryx connector
Many people are kind of scared of using programming language. And sure, if you haven’t any experience using these ‘command line’ tools the learning curve may seem steep. And why should you learn a language like Python, if you have a fantastic tool like Alteryx to process your data?
[Read more…] about Use Python as an Alteryx connectorTop 2000 van Radio 2 — 2019
Ieder jaar maak ik op basis van de laatste Top 2000 lijst van Radio 2 een nieuw (aantal) visualisaties.. De lijst zelf is niet heel erg spannend, dus is het interessant om te zien wat je met de data kunt doen…

Top 2000 – 2018
In my annual exercise of visualizing the Dutch Top 2000 I made use of a couple new Tableau tricks, like navigation buttons (a lot of work to create the on all dashboards, but well worth it) and transparent sheets:
