In my annual exercise of visualizing the Dutch Top 2000 I made use of a couple new Tableau tricks, like navigation buttons (a lot of work to create the on all dashboards, but well worth it) and transparent sheets:
The Tableau visualization has become a triptych with:
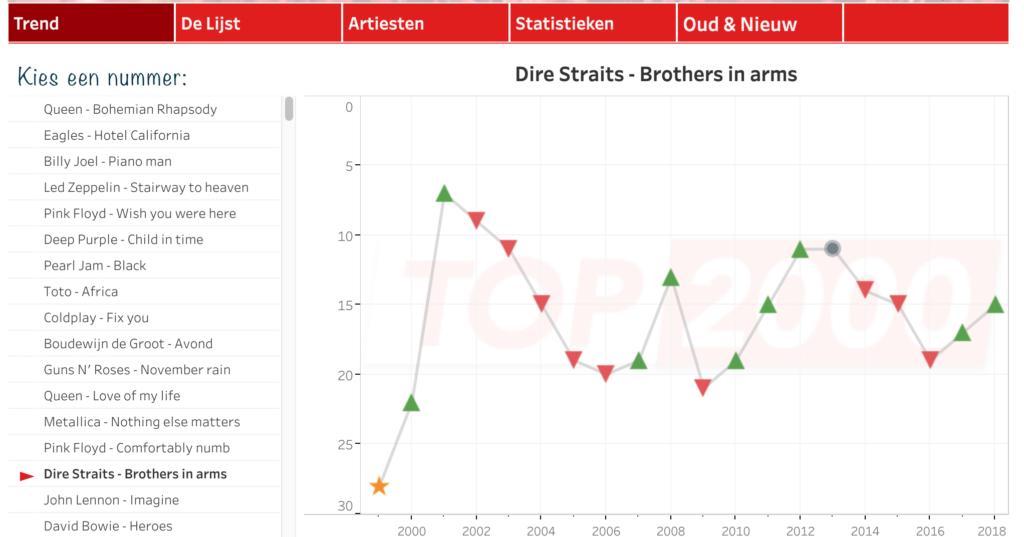
- Top 2000: an overview of all current songs in the list, and the path how they got there.
- Artists: choose your favorite artist, and see which song(s) are in the Top 2000, and what some underlying statistics of these songs are.
- Statistics: Facts about each Top 2000 year: the risers and the fallers, the newcomers and the re-entries, the repeaters and the dropouts.
Nederlands
De Tableau visualisatie is een drieluik geworden met:
- Top 2000: een overzicht van alle huidige nummers die in de lijst staan, en het pad hoe zij daar gekomen zijn.
- Artiesten: kies je favoriete artiest, en kijk welk(e) nummer(s) in de Top 2000 staan, en wat nog wat achterliggende statistieken van deze nummers zijn.
- Statistieken: Weetjes van ieder Top 2000 jaar: de stijgers en de dalers, de nieuwkomers en de re-entries, de zittenblijvers en de wegvallers.
De volledige interactieve versie is te vinden op Tableau Public.