• Skip to primary navigation
  • Skip to main content
  • Skip to primary sidebar
Antichaos

Antichaos

Data Visualisation, Tableau & Data Services

  • Home
  • Services
    • Data Analysis
    • Training
    • Portfolio
  • Blog
  • About Johan
  • Contact
  • Nederlands
  • Show Search
Hide Search

blog-en

Better datefilters in Tableau

2023-01-22 by Johan de Groot

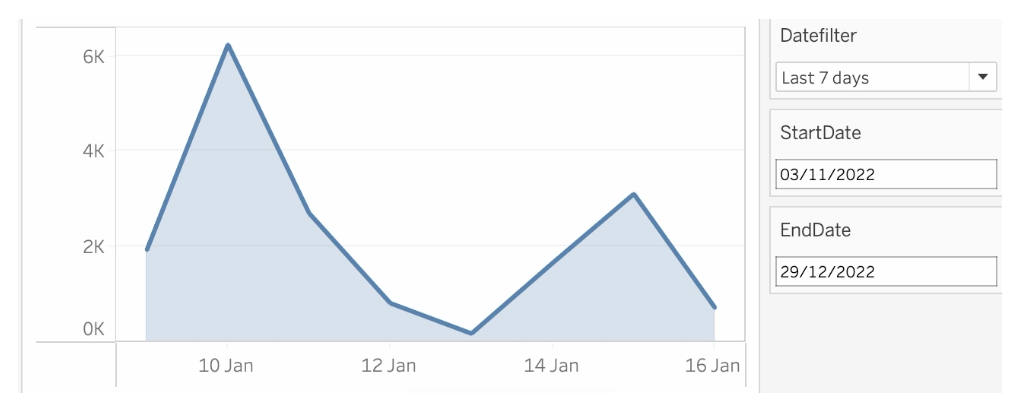
Datefilters are one of the most common filters on any dashboard. They are needed to see trends, make decisions on the right period, and analyse within the right context. But most of the times these filters are not optimal – so let’s make them better (and prettier)
[Read more…] about Better datefilters in Tableau

The Radio Top 2000 visualised – edition 2022

2023-01-10 by Johan de Groot

I visualized the Top 2000 as broadcast by Radio 2 for the 11th time (I believe) in a different way using Tableau.

[Read more…] about The Radio Top 2000 visualised – edition 2022

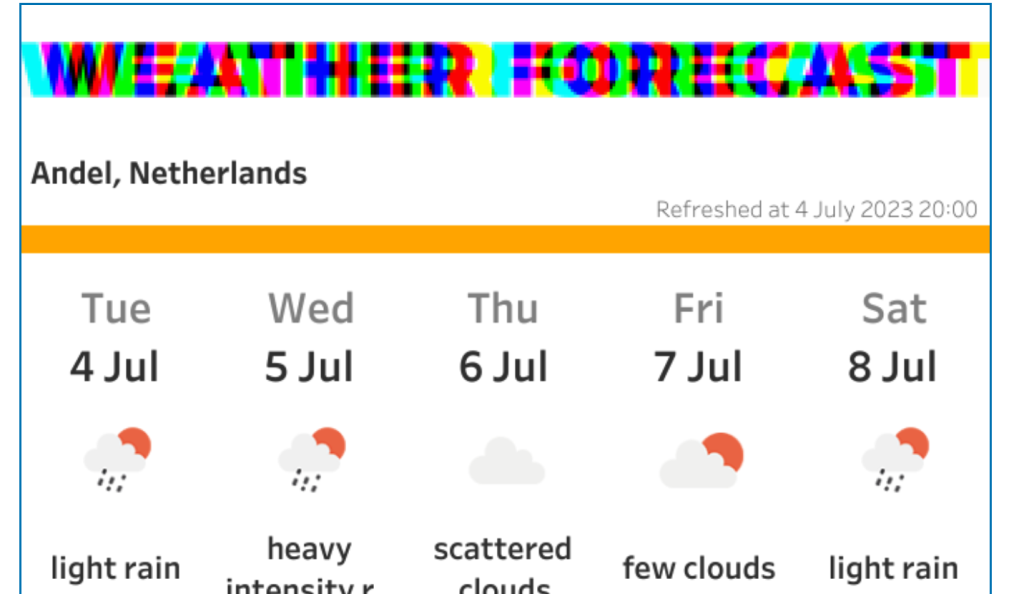
Weather Forecast in Tableau

2021-09-07 by Johan de Groot

The most talked about topic in the world is probably the weather. And if you want to talk about, you need to know the data 😉

This dashboard show the weather forecast in my location for today and the next 4 days.

[Read more…] about Weather Forecast in Tableau

Moving Skylines of the World

2021-01-20 by Johan de Groot

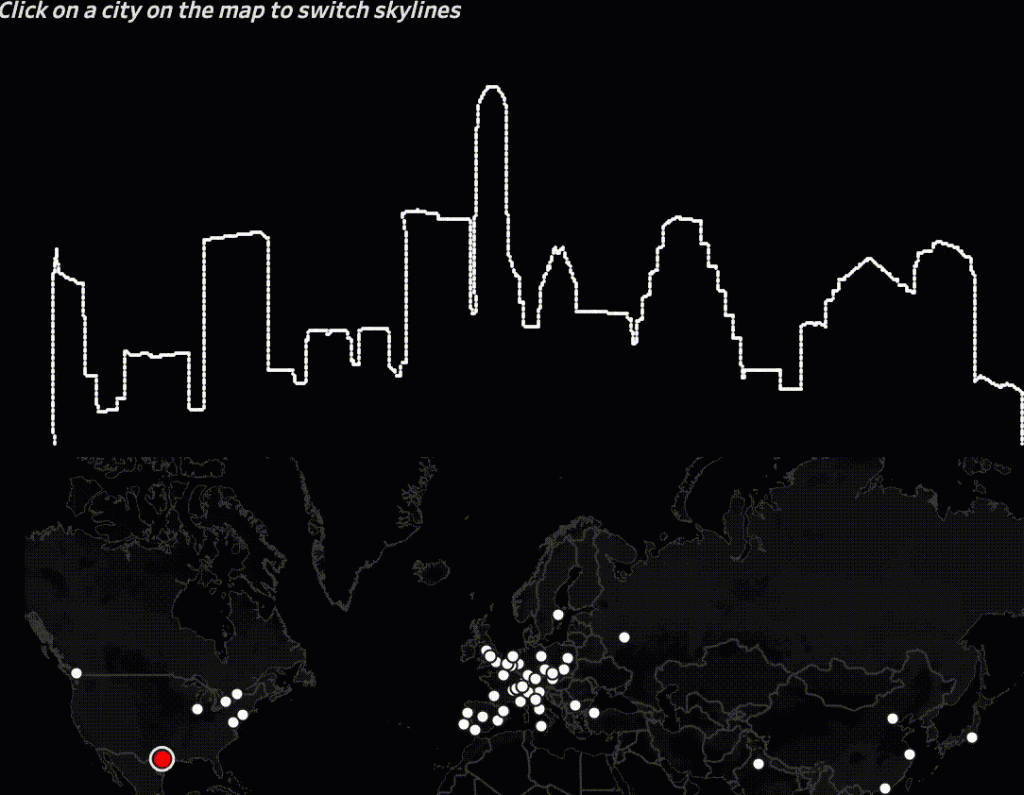
Showing the Skylines of cities in Tableau – one by one.

[Read more…] about Moving Skylines of the World

Top 2000 visualisation – edition 2020

2021-01-04 by Johan de Groot

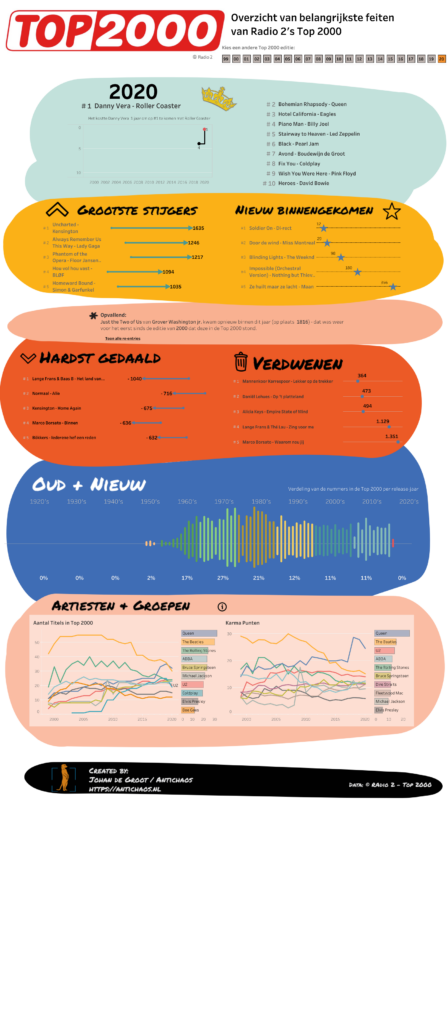
The Top 2000 edition of 2020 isn’t a fancy data visualisation with extensive data-preparation and/or mathematical formulas like last year, but a visualisation with the emphasis on what you can do with relative simple graphical elements. This approach can change the look and feel of a ‘standard’ dashboards significantly

Click on the screenshot to view – and use! – the data visualisation fullscreen.

Top 2000 visualisatie – editie 2020

2021-01-04 by Johan de Groot

(In Dutch) Voor de editie van 2020 heb ik dit keer niet gekozen voor een extreem fancy datavisualisatie met uitgebreide data-preparatie en/of ingewikkelde wiskundige formules, maar wat meer nadruk gelegd over hoe je met relatief eenvoudige grafische elementen je een dashboard een compleet ander uiterlijk kunt geven dan een ‘standaard’ dashboard.

[Read more…] about Top 2000 visualisatie – editie 2020

Bohemian Rhapsody: From Top 2000 to jump-chart

2020-10-11 by Johan de Groot

Watch my presentation of the Top 2000 jumpchart, held on the Virtual User Group meeting on May 27th 2020:

Use Python as an Alteryx connector

2020-10-04 by Johan de Groot

Many people are kind of scared of using programming language. And sure, if you haven’t any experience using these ‘command line’ tools the learning curve may seem steep. And why should you learn a language like Python, if you have a fantastic tool like Alteryx to process your data?

[Read more…] about Use Python as an Alteryx connector

Top 2000 van Radio 2 — 2019

2020-10-03 by Johan de Groot

Ieder jaar maak ik op basis van de laatste Top 2000 lijst van Radio 2 een nieuw (aantal) visualisaties.. De lijst zelf is niet heel erg spannend, dus is het interessant om te zien wat je met de data kunt doen…

[Read more…] about Top 2000 van Radio 2 — 2019

Top 2000 – 2018

2018-10-25 by Johan de Groot

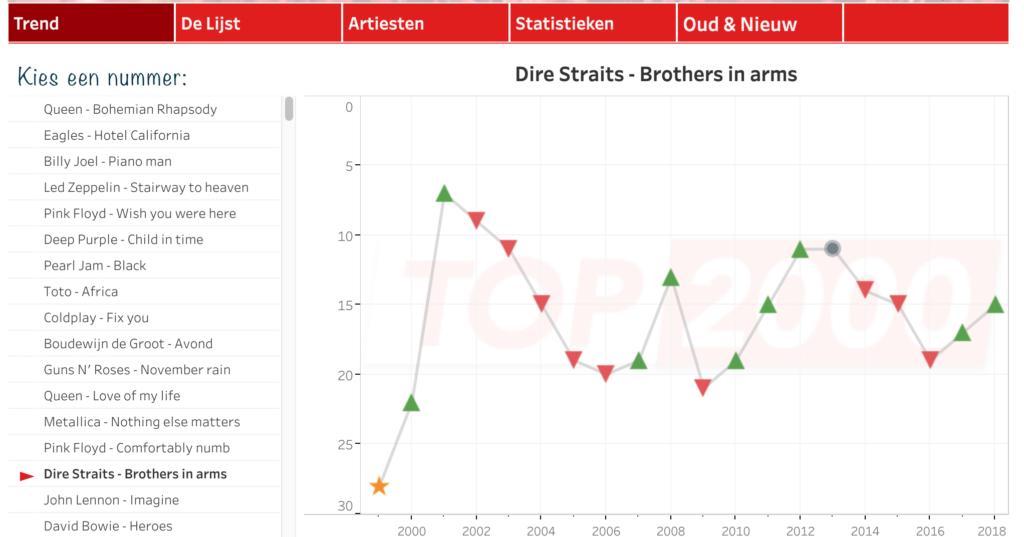
In my annual exercise of visualizing the Dutch Top 2000 I made use of a couple new Tableau tricks, like navigation buttons (a lot of work to create the on all dashboards, but well worth it) and transparent sheets:

[Read more…] about Top 2000 – 2018

Year-to-date in Tableau

2017-06-30 by Johan de Groot

If you want to compare last year to this year ‘to date’, you have to take into account that a leap-year adds 1 extra date to the year – so you can’t just compare the day-of-year from this and last year.

Often this filter is used:

DATEPART('dayofyear',[Date]) <= DATEPART('dayofyear',TODAY())

But this is a better one, since this compares day and month:

YEAR([Date]) >= YEAR(TODAY())-1
AND (MONTH([Date]) < MONTH(TODAY())
OR
(MONTH([Date]) == MONTH(TODAY())
AND DAY([Date]) <= DAY(TODAY())))

If you want to have a ‘year to date’ until today (so today excluded), use this one:

YEAR([Date]) >= YEAR(TODAY()-1)-1
AND (MONTH([Date]) < MONTH(TODAY()-1)
OR
(MONTH([Date]) == MONTH(TODAY()-1)
AND DAY([Date]) <= DAY(TODAY()-1)))

Calculate last day of month

2017-06-20 by Johan de Groot

Sometimes you need to calculate how many days a certain month – like the current month. With some nested date-calculations this isn’t that hard to calculate…

[Read more…] about Calculate last day of month

Primary Sidebar

Antichaos Services

  • Need Tableau Help ?
  • Basic, Advanced and Custom Training

Recent Blogposts

  • The Tally extension: CountTo renewed
  • 5 more Tableau Desktop Tips: Fields, Calculations & Pills
  • MeasureCamp Amsterdam 2026: the power of the blank board
  • Datafam Day 2026 – Amsterdam
  • How to create pill-style navigation in Tableau
  • Tableau Visionary 2026
  • Tableau REST API Connector: Add Live Web Data to Your Dashboards
  • Rounded Corner Maps in Tableau
  • Improving Radar Charts: Showing Overview and Details
  • Create a Radarchart in Tableau – Modular and Simple

Follow & Connect on

Antichaos

Copyright © 2026 Antichaos

  • Antichaos
  • Privacy
  • Contact