
Dashboards are usually great at showing trends, but it is always good to now why these trends are happening. News articles, press releases, blog posts can be a good addition to your daily data input.
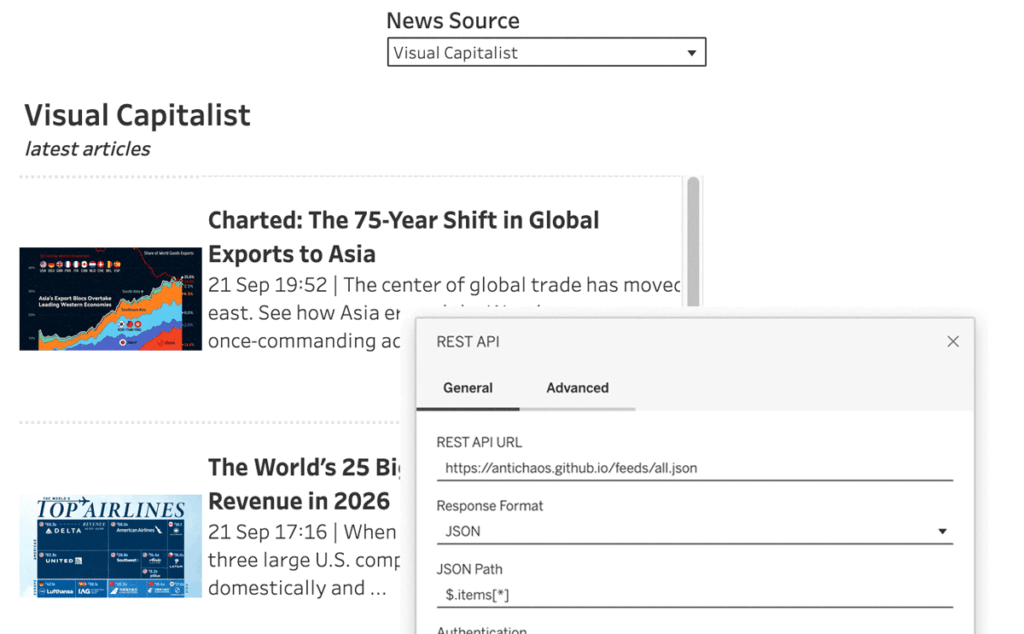
In this tutorial, we’ll close that gap by building a lightweight news feed that lives right inside a Tableau dashboard. A Python script does the scraping and processing, GitHub runs it and hosts the resulting data for free, and the Tableau REST Connector pulls it straight into your workbook: no server maintenance, no paid API, and no manual work.
How it fits together
- RSS is the format almost every news site publishes in (title, summary, date, link) – but Tableau can’t read it natively.
- REST API is how one system asks another for data over the web. Since version 2026.1, Tableau can fetch REST/JSON data directly, no extra setup.
- Python converts the RSS/XML into the JSON the REST connector expects.
- GitHub runs that Python script on a schedule and hosts the resulting JSON file, so nothing needs to run on your own machine.
Starterkit “News in your dashboard”
Nothing to install except Python (and only needed if you want to test locally), no credit card, no command line necessary. Download these three files to your computer:
- rssjson.py – downloads the news feeds and writes them as JSON/CSV
- feeds.json – which feeds to download (to start with, edit freely)
- rss.yml – tells GitHub to run the script every hour
The end result will be a URL like https://YOURNAME.github.io/feeds/all.json that Tableau reads like any other data source.
Part 1: Run it locally (optional)
Skip this part if you are in a hurry – do this part is you want to see the Tableau REST API running locally, and/or check if the feed work before publishing.
1.1 Install Python (skip if you already have it)
- Windows: download from python.org/downloads, run the installer and tick “Add python.exe to PATH” on the first screen.
- Mac: open Terminal (⌘-space, type
Terminal) and typepython3. If it isn’t installed, macOS offers to install it; say yes. Python.org has custom installers for newer versions
1.2 Open a terminal in this folder
- Windows: open this folder in File Explorer, click in the address bar, type
cmdand press Enter. A black window opens, already in this folder. - Mac: right-click the folder in Finder → Services → New Terminal at Folder (or open Terminal and type
cd, drag the folder onto the window, press Enter).
1.3 Run the script
Run the python script by typing this – followed by a Return:
python rss2json.py(Windows: use python; Mac: python3.)
You should see one line per feed, ending in something like [ok] all.json: 774 items from 6 feeds.
A new folder out now contains all.json (everything), and one .json file per feed. If an error occured, this might help:
| Error Message | Fix |
|---|---|
| python3: command not found / ‘python’ is not recognized | Python isn’t installed or wasn’t added to PATH – see 1.1 |
| No such file or directory: rss2json.py | The terminal isn’t in the right folder |
| [FAIL] some-feed: … for one feed | That news site is down or blocking your script – others still work. Remove it from feeds.json if it keeps failing |
1.4 Try it in Tableau right now (optional, running on same computer)
In the same terminal run a small webserver via Python:
cd out
python3 -m http.server 8000
Leave that window open. In Tableau Desktop:
Connect → To a Server → More… → REST API, URL http://localhost:8000/all.json,
- Response Format JSON
- JSON Path
$.items[*]
Close the terminal window when done.
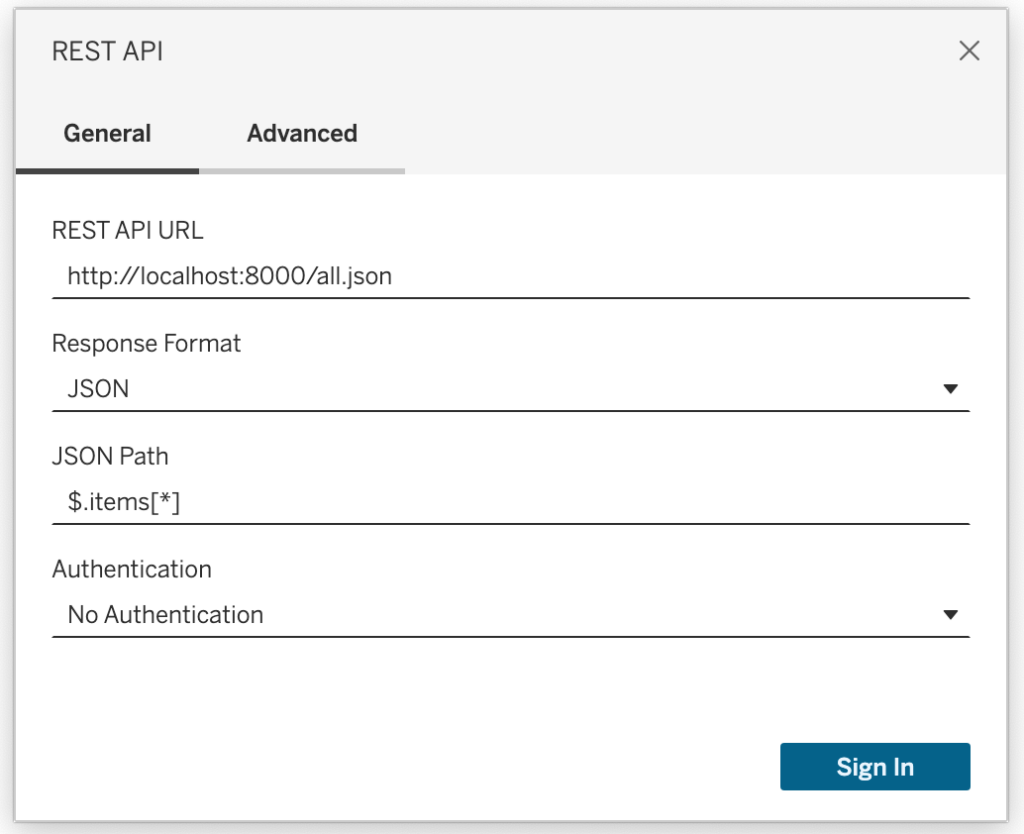
That proves everything works, but only on your machine. To let Tableau Server/Cloud reach it (or to stop running the script by hand) continue.
Part 2: put and run it online for free
You need a free account at github.com (sign up, confirm your e-mail). Everything below happens in the browser – no command line anymore.
1. Create the repository
- Go to github.com/new.
- Repository name:
feeds. Leave it Public. - Create repository.
2. Switch on GitHub Pages
Do this before adding the workflow!
- Repository → Settings (tab at the top) → Pages (left menu).
- Under Build and deployment → Source, choose GitHub Actions. (there is no save button)
3. Upload the script and the feed list
- On the repository’s front page (Code tab) click Add file → Upload files.
- Drag
rss2json.pyandfeeds.jsonfrom this folder onto the page. - Commit changes.
4. Add the hourly execution
- Add file → Create new file.
- In the name box type exactly:
.github/workflows/rss.yml
(GitHub will automatically create this file and folder). - Open
rss.ymlfrom this folder in a text editor, copy everything, paste it into the big input box. - Commit changes – this will also start the first run.
5. Watch the first run and get your URL
- Click the Actions tab. The commit from 4. has started a run; if nothing is there, choose RSS to JSON on GitHub Pages in the left menu → Run workflow → Run workflow.
- Wait about a minute; click the run when it turns green. Under deploy you see your site address:
https://YOURNAME.github.io/feeds/
This webpage lists every file with its size. Your Tableau URL ishttps://YOURNAME.github.io/feeds/all.json
From now on GitHub re-downloads the feeds every hour at 42 minutes past, automatically, for free. Nothing runs on your computer any more.
Run failed with a red cross? Click it and read the first error:
| Error | Fix |
|---|---|
| Get Pages site failed … Not Found | Pages wasn’t turned on: do step 2, then re-run the failed job |
| No such file or directory: rss2json.py / feeds.json | Files aren’t at the top level of the repository |
| Yellow warnings about Node.js or Ubuntu versions | Ignore these |
Part 3: Connect Tableau

Install the REST API Connector from Tableau Exchange if it isn’t already listed, then:
Connect → To a Server → More → REST API, using the URL from step 5 above.
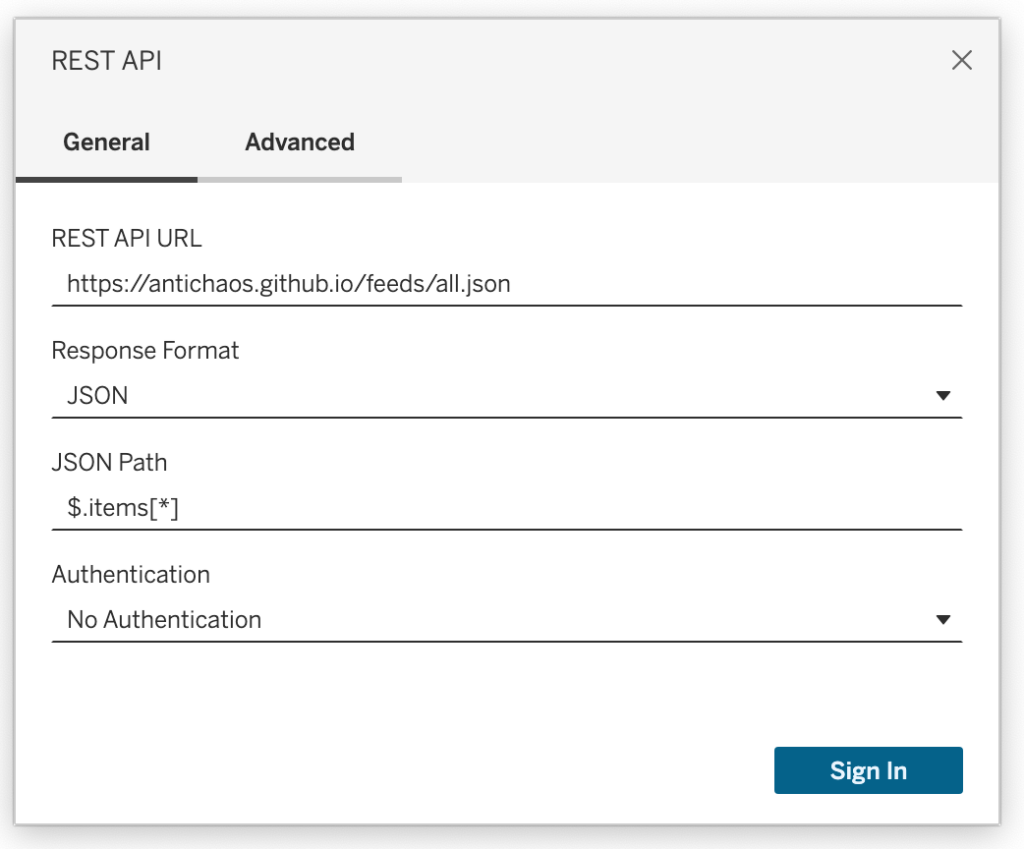
Tableau fetches the datasource always as an extract. GitHub refreshes the source data hourly, but you still need to schedule extract refreshes yourself on Tableau Server/Cloud, e.g. at the 45th minute of each hour, a few minutes after GitHub’s run.
- Publish the datasource to Tableau Server or Cloud
- Schedule the refreshes. If you followed the instructions, every ’42nd minute after the hour’ the data is being fetched, so you might want to schedule a data refresh at the 45th minute of each hour.
Create a view
In Tableau Desktop, connect your workbook to the new datasource on Tableau Server or Cloud.
Useful first steps in the workbook:
publishedandupdatedarrive as text in UTC
→ create a calculated fieldDATETIME([published]).feed_slugtells you which feed a row came fromlinkopens the article (add it as a URL action).image_urlcan be shown with an Image Role (Tableau 2022.4+).categoriesis comma-separated;SPLIT([categories], ",", 1)gets the first.
From here it’s a usual Tableau build: a list or card view of headlines, sorted by date, filtered/colored by feed_slug, with the URL action wired to link. Limit the number of items by filtering on GUID (the unique id of each article) top 5 by datetime

Changing and adding newsfeeds
Of course you want to add your own news sources. Open feeds.json in any text editor. Each feed is one block:
{
  "slug": "bbc-world",
  "url": "https://feeds.bbci.co.uk/news/world/rss.xml",
  "name": "BBC News – World",
  "category": "International news"
}- slug is a short name you choose (letters, digits, dashes) – it becomes the file name and the feed_slug column.
- url is the feed address.
nameis the friendly namecategorycan be used to group or filter news feeds
Add or remove blocks (mind the commas between them), then run the script again, or on GitHub open feeds.json → pencil icon → edit → Commit changes (that also triggers a fresh run).
Tip: Google News search
Create your own topical news feed on YOUR TERM:
https://news.google.com/rss/search?q=%22YOUR+TERM%22&hl=en-US&gl=US&ceid=US:en
works for any keyword, company name, or exact phrase (quote it for exact match). Swap hl/gl/ceid for other locales, e.g. nl-NL&gl=NL&ceid=NL:nl for Dutch results.
Tips on visualizing the Feeds
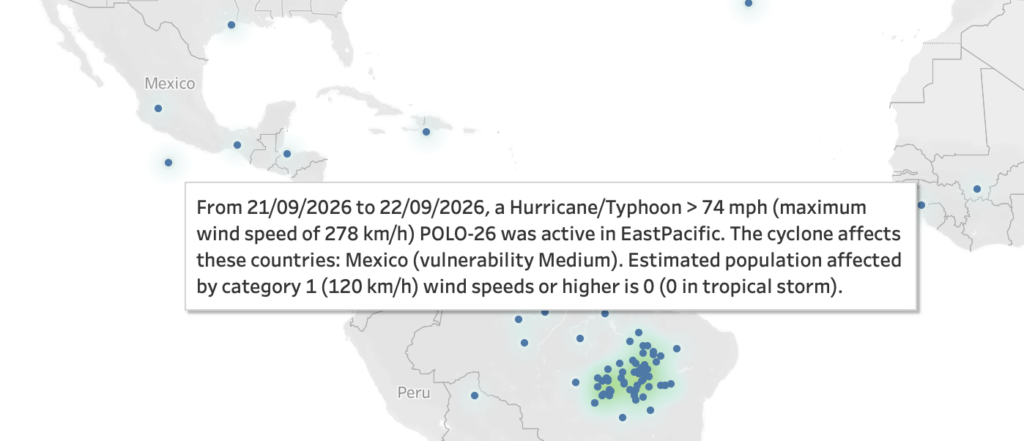
- Both the USGS earthquakes and GDACS global disaster alerts contain spatial data – I added a longitude and latitude field so these can be plotted live on a map!
- When using Image Roles, be aware of its restrictions. If you use many and/or large images, the don’t always show. Limit the number of images.
- These datasource (earthquakes and disasters) contain spatial data: the exact location as latitude and longitude. I added these as extra fields using the Python script. The news doesn’t have to be a list – it can also be a map!
Good to know
- Everything you publish is public. Gists and Pages are readable by anyone with the link. The six feeds included allow this; some publishers (e.g. NU.nl) forbid it — check before you add a feed.
- It is a snapshot. Each run replaces the files with what the feed contains now (usually the last 10–100 items).
- GitHub pauses the hourly job after 60 days without changes to the repository. You get an e-mail; editing any file (or Run workflow) switches it back on.
- Cost: nothing. Public repositories on Github get unlimited job minutes and a run takes under a minute.
- If you are not allowed to install the JDBC connector on your laptop, just create the datasource on Tableau Cloud/Server directly, using ‘New – Published Datasource’
- RSS is a standard – but one with many implementations. You will encounter ‘strange’ feeds: with or without images, extremely long text, and broken feeds.