• Skip to primary navigation
  • Skip to main content
  • Skip to primary sidebar
Antichaos

Antichaos

Data Visualisation, Tableau & Data Services

  • Home
  • Services
    • Training
    • Portfolio
  • About Johan
  • Blog
  • Contact
  • Nederlands
  • Show Search
Hide Search

Developer

Tableau REST API Connector: Add Live Web Data to Your Dashboards

2026-03-12 by Johan de Groot

With Tableau 2026.1, a major new feature has arrived. You can now bring fresh, live data from web services directly into your dashboards – no scripts, no intermediate databases, and no manual imports required.

Few steps from Connector to Dashboard

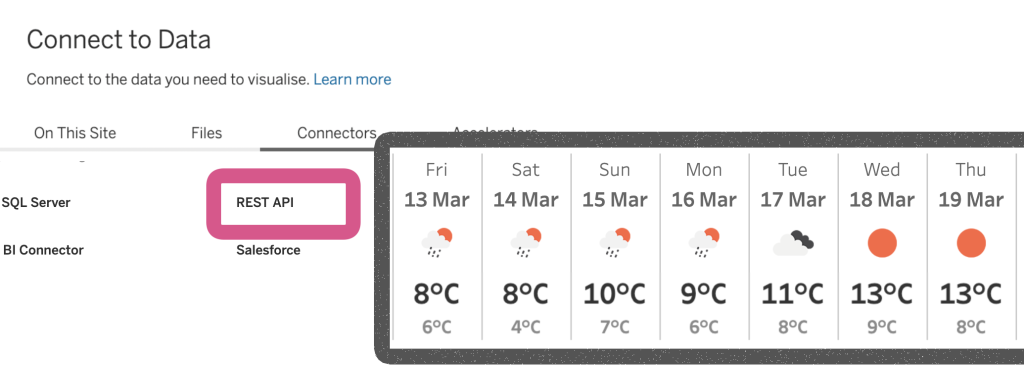
Whether you want to monitor the latest sales from your CRM, track website visits in near real-time, or display the current weather for operational planning, the REST API Connector makes it simple to integrate external data into Tableau Server or Tableau Cloud.

This feature is particularly useful for analysts who need near‑real‑time operational data (CRM updates, event logs, weather, IoT signals) without traditional ETL workflows.

[Read more…] about Tableau REST API Connector: Add Live Web Data to Your Dashboards

Fetch API data real-time in Tableau

2025-04-10 by Johan de Groot

Getting data from external APIs into Tableau often involves several workarounds —manual extracts, middle-ware scripts, or writing to a database. This isn’t bad per se, but if you just want real time data from an API, Table Extensions are a clean and direct solution.

Table Extensions allow you to connect Tableau directly to external data sources like APIs using Python, R, or other analytics engines. This means you can fetch live data—whether it’s weather updates, currency exchange rates, or stock prices—and use it as if it were a regular data source in Tableau.

In this post, I’ll walk you through how to set up your first Table Extension, use Python to pull live data (without storing anything), and explore the benefits and best practices of using this approach—especially when working with real-time or short-lived data.

[Read more…] about Fetch API data real-time in Tableau

Better Titles on Multiple Measure Panes

2025-03-06 by Johan de Groot

Similar to titles on small multiples, showing title only in the axis on multiple-measure charts is not user friendly. The visuals distance between title and the data is too large, and vertical text is never easy to read:

Let’s look at an easy ways to enhance the labels for better clarity and user experience.

[part of the ‘Datafam London 2024 – Deepcleaning your dashboard’ series]

[Read more…] about Better Titles on Multiple Measure Panes

Write your own Tableau Extension for your current dashboard

2022-09-29 by Johan de Groot

Tableau Extensions are a way to extend the functionality of a dashboard to your own specific needs. Most people using extensions simply grab one of the many offered via the Tableau Exchange (free or paid).

In this post I would like to encourage you to think about another option: creating your own extension!

[Read more…] about Write your own Tableau Extension for your current dashboard

Write your own Tableau Extension for your current dashboard

2022-07-05 by Johan de Groot

Tableau Extensions are a way to extend the functionality of a dashboard to your own specific needs. Most people using extensions simply grab one of the many offered via the Tableau Exchange (free or paid).

In this post I would like to encourage you to think about another option: creating your own extension!

[Read more…] about Write your own Tableau Extension for your current dashboard

Primary Sidebar

Antichaos Services

  • Need Tableau Help ?
  • Basic, Advanced and Custom Training

Recent Blogposts

  • How to create pill-style navigation in Tableau
  • Tableau Visionary 2026
  • Tableau REST API Connector: Add Live Web Data to Your Dashboards
  • Rounded Corner Maps in Tableau
  • Improving Radar Charts: Showing Overview and Details
  • Create a Radarchart in Tableau – Modular and Simple
  • Radar Charts: Practical tips for when and how to use them
  • Smarter dashboard design – with fewer tooltips
  • Top 2000 in Perspective – Behind the Scenes
  • How to Visualize High-Value Metrics in Tableau Without Starting at Zero

Follow & Connect on

Antichaos

Copyright © 2026 Antichaos

  • Antichaos
  • Privacy
  • Contact