• Skip to primary navigation
  • Skip to main content
  • Skip to primary sidebar
Antichaos

Antichaos

Data Visualisation, Tableau & Data Services

  • Home
  • Blog
  • Services
  • Training
  • Portfolio
  • Contact
  • Nederlands
  • Show Search
Hide Search

Featured

Tableau Hyper API now on Apple Silicon

2024-06-23 by Johan de Groot

The June 2024 release of the Hyper API (version 0.0.19484) is available – and it now finally supports Apple Silicon!

[Read more…] about Tableau Hyper API now on Apple Silicon

Weather Forecast dashboard in Tableau

2024-04-03 by Johan de Groot

It’s just a couple of weeks before TC24 in San Diego… So we want to know what the weather is out there!

Or at home. Or any other place in the world.
What better than building your own weather forecast in Tableau!?

[Read more…] about Weather Forecast dashboard in Tableau

Custom Tableau Shapes on maps – beware!

2024-01-28 by Johan de Groot

The ‘shapes’ functionality in Tableau is a nice way to enhance and personalize a visualization. But be aware what exactly you are decoration – especially on maps.

[Read more…] about Custom Tableau Shapes on maps – beware!

Top 2000 of 2023 – what stood out?

2023-12-31 by Johan de Groot

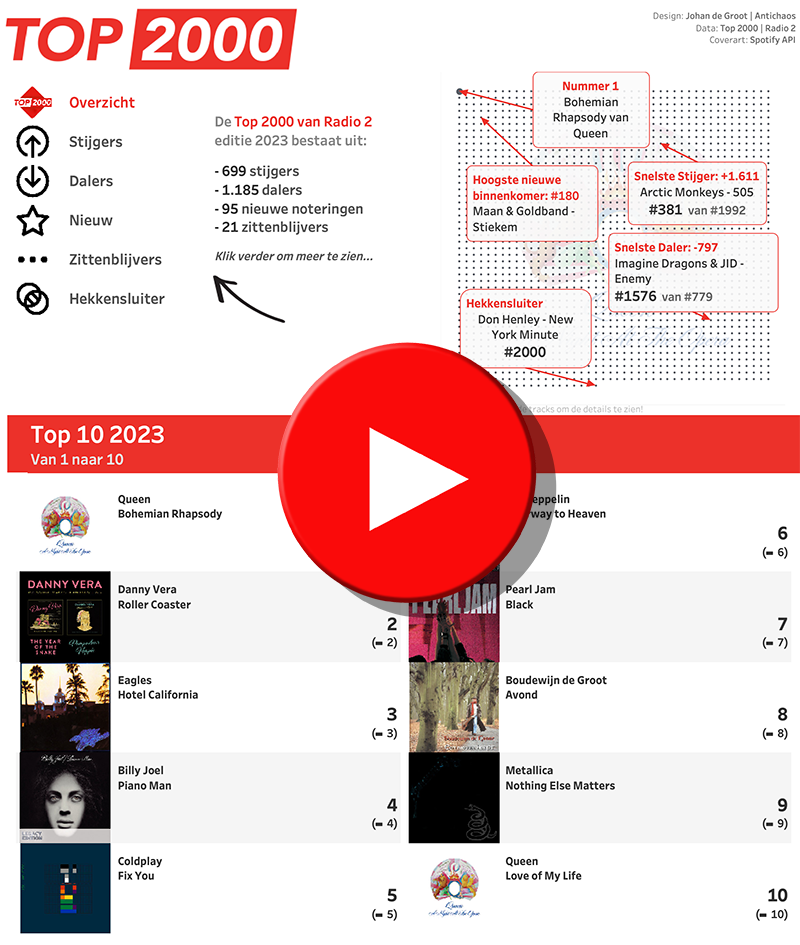
The Top 2000 of Radio 2 (a populair Dutch radio station) has been broadcast for the 25th time – and traditionally I am trying to turn this into a ‘different’ interactive data visualization…

[Read more…] about Top 2000 of 2023 – what stood out?

Dynamic value format – Better labels in Tableau

2023-11-19 by Johan de Groot

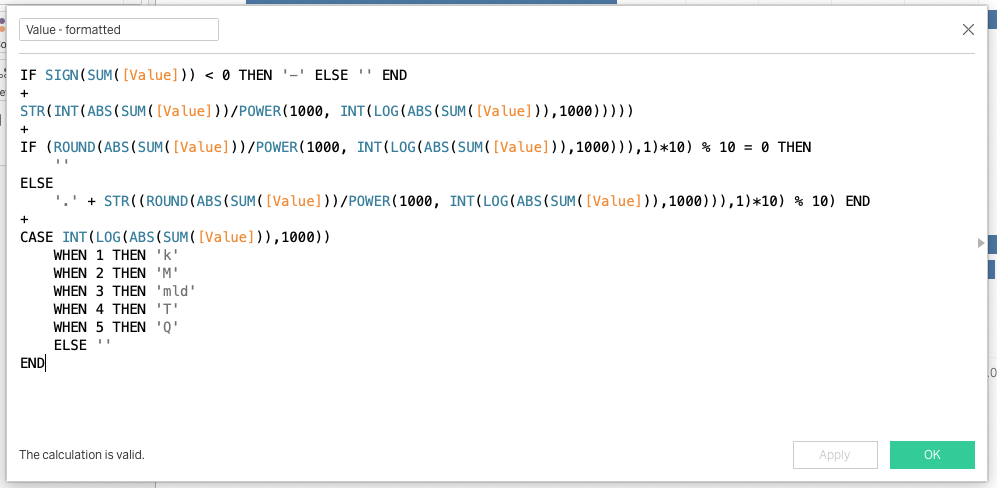
Labels are often an after-thought for many users – we don’t like them, but are necessary. Using some simple steps we can create better labels which are easier to interpret for the users of the dashboard.


[This blogpost is part of a series tips tricks, as being presented at VizIt Berlin 2023]

[Read more…] about Dynamic value format – Better labels in Tableau
  • Page 1
  • Page 2
  • Go to Next Page »

Primary Sidebar

Antichaos Services

  • Need Tableau Help ?
  • Basic, Advanced and Custom Training

Recent Blogposts

  • Smarter dashboard design – with fewer tooltips
  • Top 2000 in Perspective – Behind the Scenes
  • How to Visualize High-Value Metrics in Tableau Without Starting at Zero
  • Why is COUNTD so slow – and how can I fix this?
  • Visualizing ‘Dynamic’ Data using a Sine Wave
  • Add ‘All’ and more options to a Dynamic Parameter
  • Tableau Container Art – 4 examples of formatting dashboards without images
  • Letting Users Choose Their Visual
  • The Tableau VizQL Data Service: What It Is, What It Can Do, and When to Use It
  • Abbreviate long text in Tableau

Antichaos

Copyright © 2026 Antichaos

  • Antichaos
  • Privacy
  • Contact