• Skip to primary navigation
  • Skip to main content
  • Skip to primary sidebar
Antichaos

Antichaos

Data Visualisation, Tableau & Data Services

  • Home
  • Services
    • Training
    • Portfolio
  • About Johan
  • Blog
  • Contact
  • Nederlands
  • Show Search
Hide Search
Home » Blog » Weather Forecast dashboard in Tableau

Weather Forecast dashboard in Tableau

2024-04-03 by Johan de Groot

It’s just a couple of weeks before TC24 in San Diego… So we want to know what the weather is out there!

Or at home. Or any other place in the world.
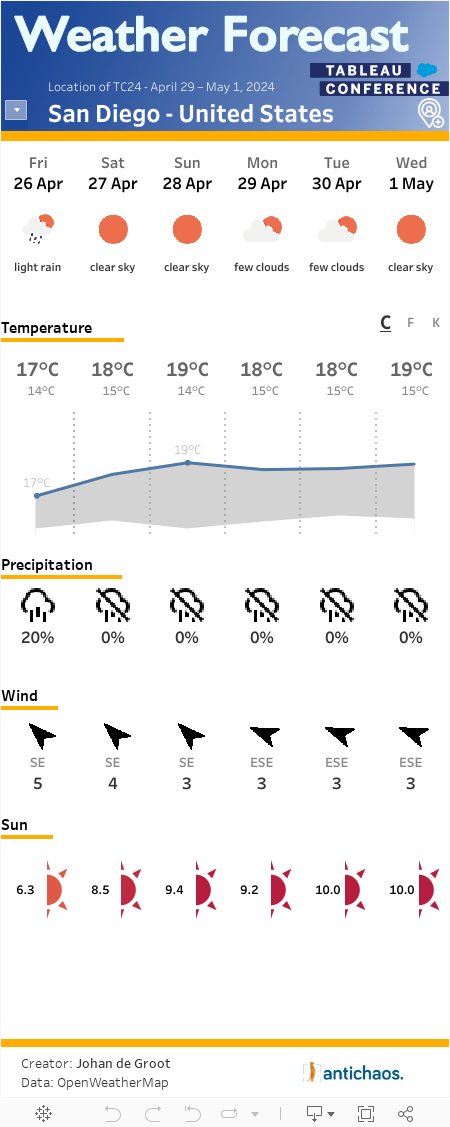
What better than building your own weather forecast in Tableau!?

This dashboard is updated every day on Tableau Public using Google Sheets. Because Tableau Public only refreshes the dashboard once a day at ‘some’ time, the current date can be skewed.

Soon more on the used techniques – Python, Google Sheets, the OpenWeather API and more.

Do you want your location added to the dashboard? Let me know using this form!

Data Visualisations, Featured, Tableau

Primary Sidebar

Antichaos Services

  • Need Tableau Help ?
  • Basic, Advanced and Custom Training

Recent Blogposts

  • How to create pill-style navigation in Tableau
  • Tableau Visionary 2026
  • Tableau REST API Connector: Add Live Web Data to Your Dashboards
  • Rounded Corner Maps in Tableau
  • Improving Radar Charts: Showing Overview and Details
  • Create a Radarchart in Tableau – Modular and Simple
  • Radar Charts: Practical tips for when and how to use them
  • Smarter dashboard design – with fewer tooltips
  • Top 2000 in Perspective – Behind the Scenes
  • How to Visualize High-Value Metrics in Tableau Without Starting at Zero

Follow & Connect on

Antichaos

Copyright © 2026 Antichaos

  • Antichaos
  • Privacy
  • Contact