• Skip to primary navigation
  • Skip to main content
  • Skip to primary sidebar
Antichaos

Antichaos

Data Visualisation, Tableau & Data Services

  • Home
  • Blog
  • Services
  • Training
  • Portfolio
  • Contact
  • Nederlands
  • Show Search
Hide Search
Home » Blog

Blog

Top 2000 van 2018

2018-12-31 by Johan de Groot

Top 2000 — 2018

2018-12-25 by Johan de Groot

(in Dutch…)

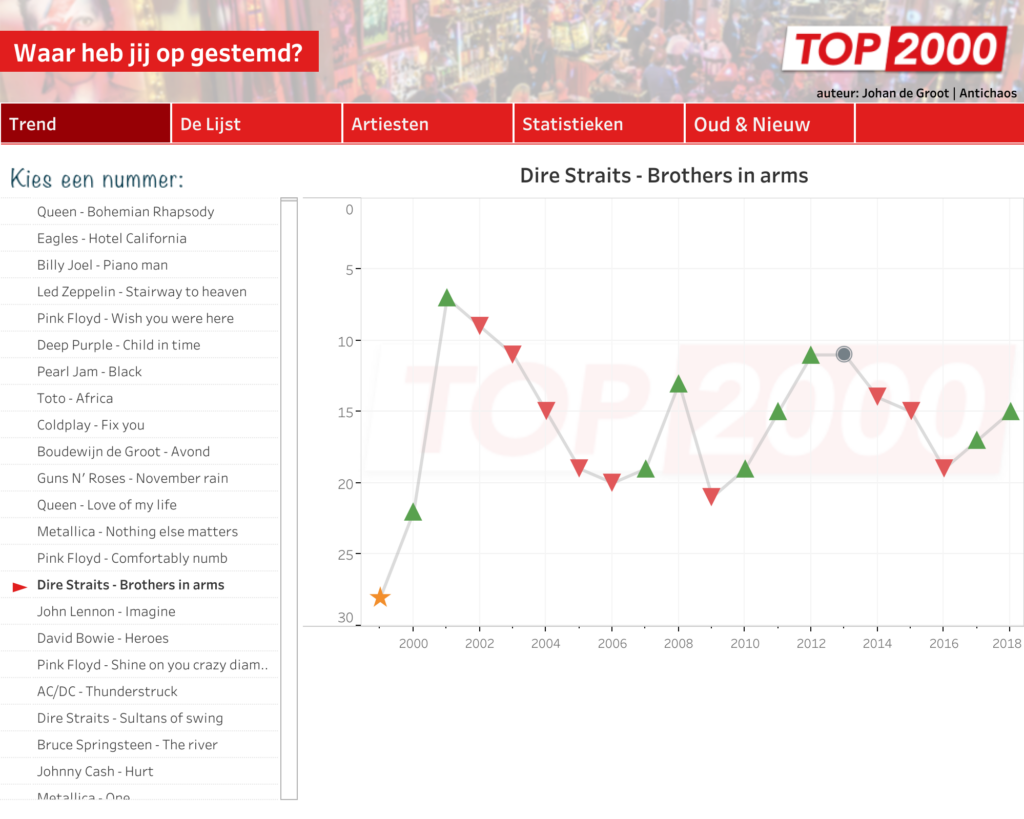
Dit jaar heb ik er voor gekozen om de beweging van de individuele titels te benadrukken. Met behulp van een een ‘jump plot’ kun je weergeven hoe iets over een as heen beweegt – zoals een nummer door de Top 2000 jaren heen over de posities 1 tot 2000 – en vaak ook hierbuiten

En met behulp van dezelfde formules is het ook mogelijk om lijnen tussen elementen een stuk vloeiender te maken dan zomaar een rechte lijn:

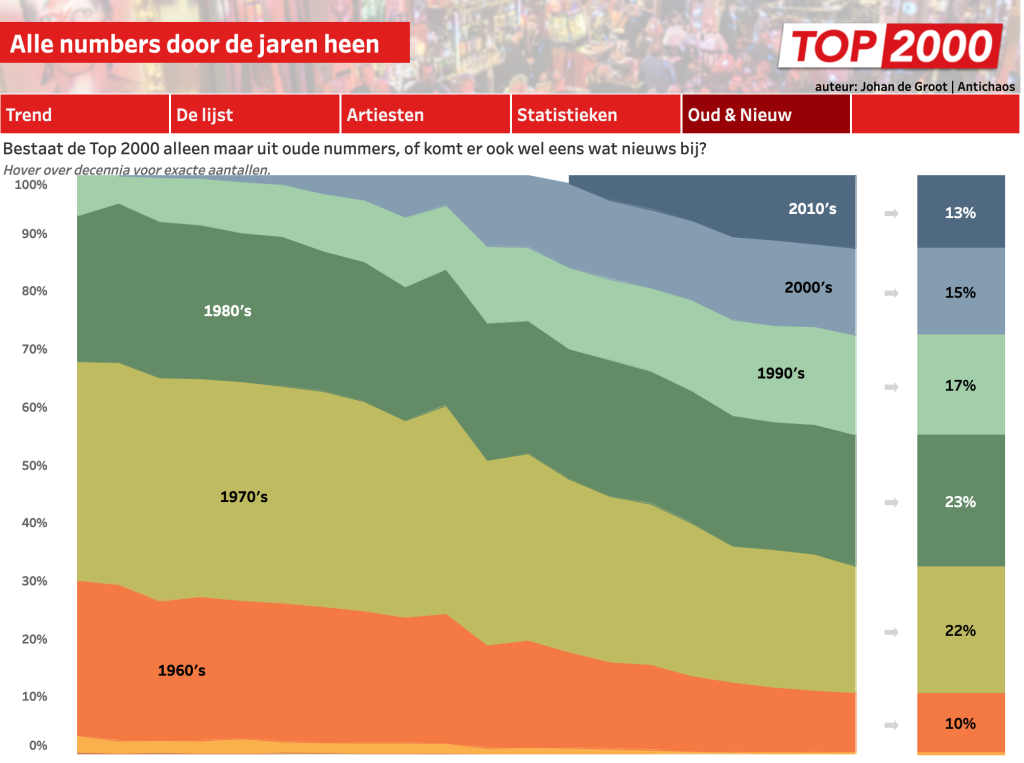
De Tableau visualisatie is een drieluik geworden met:

  • Top 2000: een overzicht van alle huidige nummers die in de lijst staan, en het pad hoe zij daar gekomen zijn.
  • Artiesten: kies je favoriete artiest, en kijk welk(e) nummer(s) in de Top 2000 staan, en wat nog wat achterliggende statistieken van deze nummers zijn.
  • Statistieken: Weetjes van ieder Top 2000 jaar: de stijgers en de dalers, de nieuwkomers en de re-entries, de zittenblijvers en de wegvallers.

Binnenkort zal ik de werkwijze en bijbehorende formules beschrijven (zeker niet zo lastig als je op het eerste gezicht zou denken).

Top 2000 – 2018

2018-10-25 by Johan de Groot

In my annual exercise of visualizing the Dutch Top 2000 I made use of a couple new Tableau tricks, like navigation buttons (a lot of work to create the on all dashboards, but well worth it) and transparent sheets:

[Read more…] about Top 2000 – 2018

Top 2000 Radio 2 – editie 2017

2017-12-31 by Johan de Groot

ISO weeks in Tableau

2017-06-30 by Johan de Groot

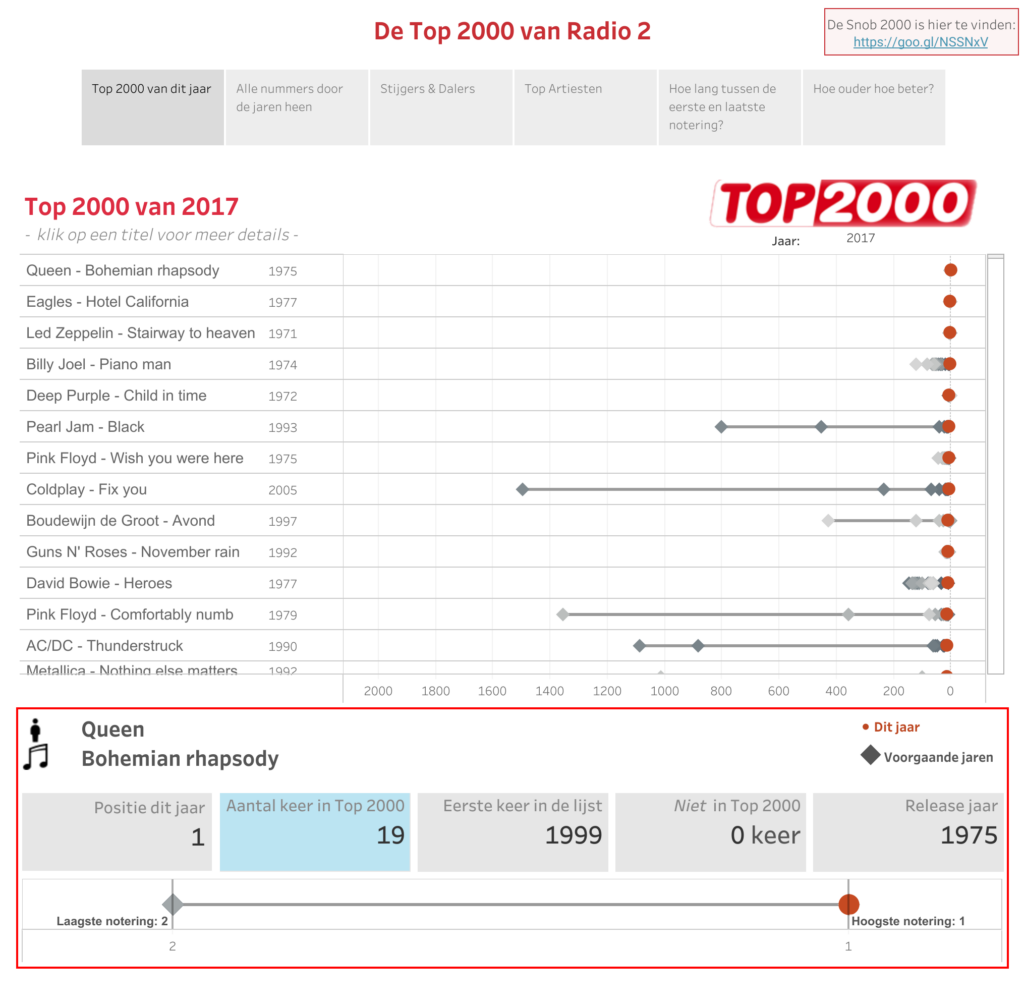
Tableau can handle all kind of dates and dateformats very well – but one option is lacking: the use of ISO8601 weeknumbers, the one which is used all over the world, especially in Europe. 

[Read more…] about ISO weeks in Tableau
  • « Go to Previous Page
  • Page 1
  • Interim pages omitted …
  • Page 15
  • Page 16
  • Page 17
  • Page 18
  • Page 19
  • Go to Next Page »

Primary Sidebar

Antichaos Services

  • Need Tableau Help ?
  • Basic, Advanced and Custom Training

Recent Blogposts

  • Create a Radarchart in Tableau – Modular and Simple
  • Radar Charts: Practical tips for when and how to use them
  • Smarter dashboard design – with fewer tooltips
  • Top 2000 in Perspective – Behind the Scenes
  • How to Visualize High-Value Metrics in Tableau Without Starting at Zero
  • Why is COUNTD so slow – and how can I fix this?
  • Visualizing ‘Dynamic’ Data using a Sine Wave
  • Add ‘All’ and more options to a Dynamic Parameter
  • Tableau Container Art – 4 examples of formatting dashboards without images
  • Letting Users Choose Their Visual

Follow & Connect on

Antichaos

Copyright © 2026 Antichaos

  • Antichaos
  • Privacy
  • Contact