Honored and proud to be selected a 2021 Tableau Ambassador!
Looking forward to work, learn and share ‘all things Tableau’ with even more people. Thanks Tableau, and congratulations to all new and returning Tableau Ambassadors.
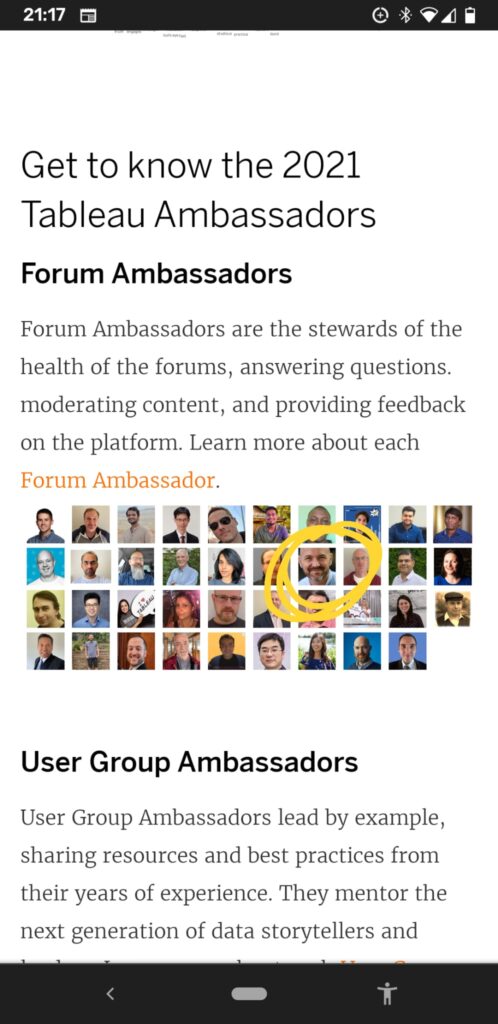
More information on all Tableau Ambassadors 2021 can be found here: https://www.tableau.com/about/blog/2021/9/congratulations-and-welcome-2021-tableau-ambassadors