• Skip to primary navigation
  • Skip to main content
  • Skip to primary sidebar
Antichaos

Antichaos

Data Visualisation, Tableau & Data Services

  • Home
  • Blog
  • Services
  • Training
  • Portfolio
  • Contact
  • Nederlands
  • Show Search
Hide Search
Home » Blog » Top 2000 visualisatie – editie 2020

Top 2000 visualisatie – editie 2020

2021-01-04 by Johan de Groot

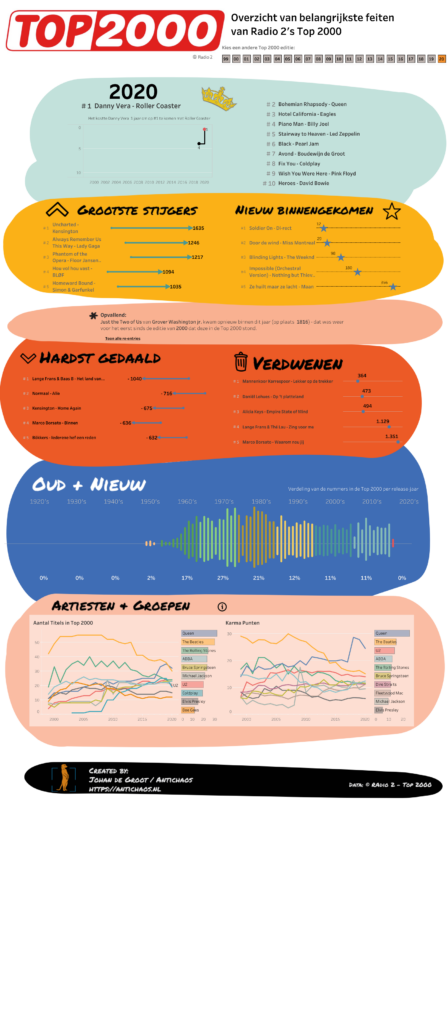
(In Dutch) Voor de editie van 2020 heb ik dit keer niet gekozen voor een extreem fancy datavisualisatie met uitgebreide data-preparatie en/of ingewikkelde wiskundige formules, maar wat meer nadruk gelegd over hoe je met relatief eenvoudige grafische elementen je een dashboard een compleet ander uiterlijk kunt geven dan een ‘standaard’ dashboard.

Klik op de visualisatie om deze full-screen te bekijken – en vooral te gebruiken!

blog-en, blog-nl, Top 2000

Primary Sidebar

Antichaos Services

  • Need Tableau Help ?
  • Basic, Advanced and Custom Training

Recent Blogposts

  • Smarter dashboard design – with fewer tooltips
  • Top 2000 in Perspective – Behind the Scenes
  • How to Visualize High-Value Metrics in Tableau Without Starting at Zero
  • Why is COUNTD so slow – and how can I fix this?
  • Visualizing ‘Dynamic’ Data using a Sine Wave
  • Add ‘All’ and more options to a Dynamic Parameter
  • Tableau Container Art – 4 examples of formatting dashboards without images
  • Letting Users Choose Their Visual
  • The Tableau VizQL Data Service: What It Is, What It Can Do, and When to Use It
  • Abbreviate long text in Tableau

Antichaos

Copyright © 2026 Antichaos

  • Antichaos
  • Privacy
  • Contact