
Tableau ships by default with arrows, circles and smileys – but not your brand icons. Adding your own icons is easy: one folder, your icons, and a button.
Six steps
1. Get your icons ready.
Use PNG with a transparent background. SVG are unfortunately not supported.
Keep every image on a square canvas so the marks line up. De details on size are in the next section – get them right to avoid re-doing this.
2. Open your Tableau repository
Paste the path into Explorer or Finder:
%USERPROFILE%\Documents\My Tableau Repository\Shapes ~/Documents/My Tableau Repository/Shapes If you can’t find it, someone moved the repository. In Tableau, check File → Repository Location to see where it actually points.
3. Create a folder, with a clear name
Make a new folder inside Shapes and give it the name you want to see in the picker – Antichaos Icons, Traffic Light, Client Logos. Don’t put the new icons into Arrows or KPI: a Tableau upgrade can overwrite the built-in ones and take your icons with them.
4. Drop the images in and name the files
The filename minus its extension is what Tableau shows under each shape, so Up.png is much clearer than icon-final-v3(2).png. Prefix with numbers if assignment order matters – Tableau walks the palette alphabetically when it hands shapes out.
Documents
└── My Tableau Repository
    └── Shapes
        ├── Arrows
        ├── Filled
        ├── KPI
        └── Antichaos Icons   ← a folder = a palette
            ├── 01 Up.png
            ├── 02 Flat.png
            └── 03 Down.png
Every folder inside Shapes becomes one palette in the shape picker, and the folder name is the palette name. That is the entire concept — the rest of this page is doing it well.
5. Load the palette in Tableau
- Set the mark type to Shape, or drag a dimension onto Shape on the Marks card.
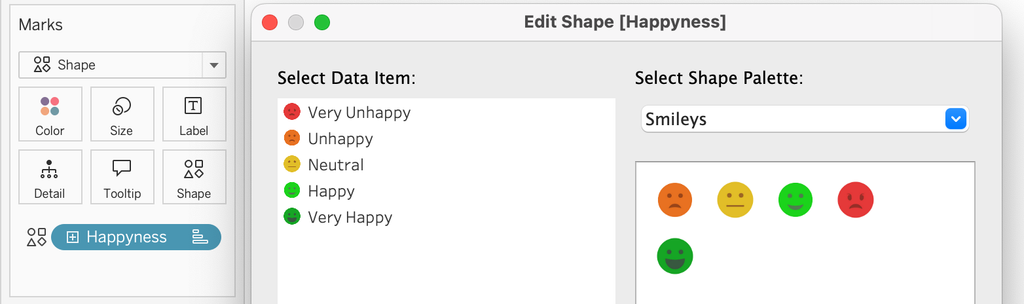
- Click the Shape card, then More Shapes…
- Hit Reload Shapes – you don’t need to restart Tableau.
- Pick your palette from the dropdown.
6. Assign the shapes
Click Assign Palette to map shapes to values in one go, or select a value on the left and a shape on the right to do it by hand. Manual assignment is worth it whenever meaning matters: you want the down arrow on Declining, not alphabetically sorted.
Icons that work well with a dashboard
Some guidelines on how to make this work best:
- Format PNG with transparency by default. No transparancy, or JPG, means an ugly white box behind every mark/shape.
- Keep the size between 64-128 px square. Larger will only increase the size of the workbook, smaller will make the shapes grainy.
- Use the same padding on each canvas square. Tableau scales the whole image, so an icon with lots of whitespace around the image renders smaller than ones without it.
- Use the right colors in de image – Tableau will not recolour the image using the Color shelf. Red, amber and blue shape variants are three files
- Keep the number of shapes small. More than 6 – really max 12 – is already hard to read for the user, and every image in a pallet is loaded when the picker opens.
- Icons pulled from popular icons websites from Flaticon or Noun Project, but also most icons-finds from a Google image search come with attribution and commercial-use terms attached. Check them before the logo lands in a dashboard.
Common issues
A number of things can/will happen:
- The palette does not show up
You added files, but in the wrong location, like in Shapes itself instead of a folder inside it, or you just skipped Reload Shapes. - A colleague opens the workbook and sees blanks or default shapes
The repository is only available on your local Desktop.
Save as a packaged workbook (.twbx), and publish with external files included so the images travel with it. Also store the folder with images on a safe shared location if they need to edit. - No options in Webedit
Web authoring on Tableau Cloud or Server has no repository. Use Desktop to add a palette to a workbook. - Fuzzy shapes
A 12px pnx will render blurry if sized large. Re-export larger.
Make it reusable
A shape palette is just a folder, which makes it easyly shareable: zip it, drop it in your team’s shared drive, and everyone unzips it into their own Shapes folder. Do that once with your brand icons and every dashboard the team builds starts consistent instead of getting fixed later.