
Smooth lines in a chart look friendly. Plenty of tools, like Excel, Power BI, Dash and ECharts, offer them with a single checkbox or a “smooth: true” setting. If you’re tempted to use them, or someone asks you to, politely decline.
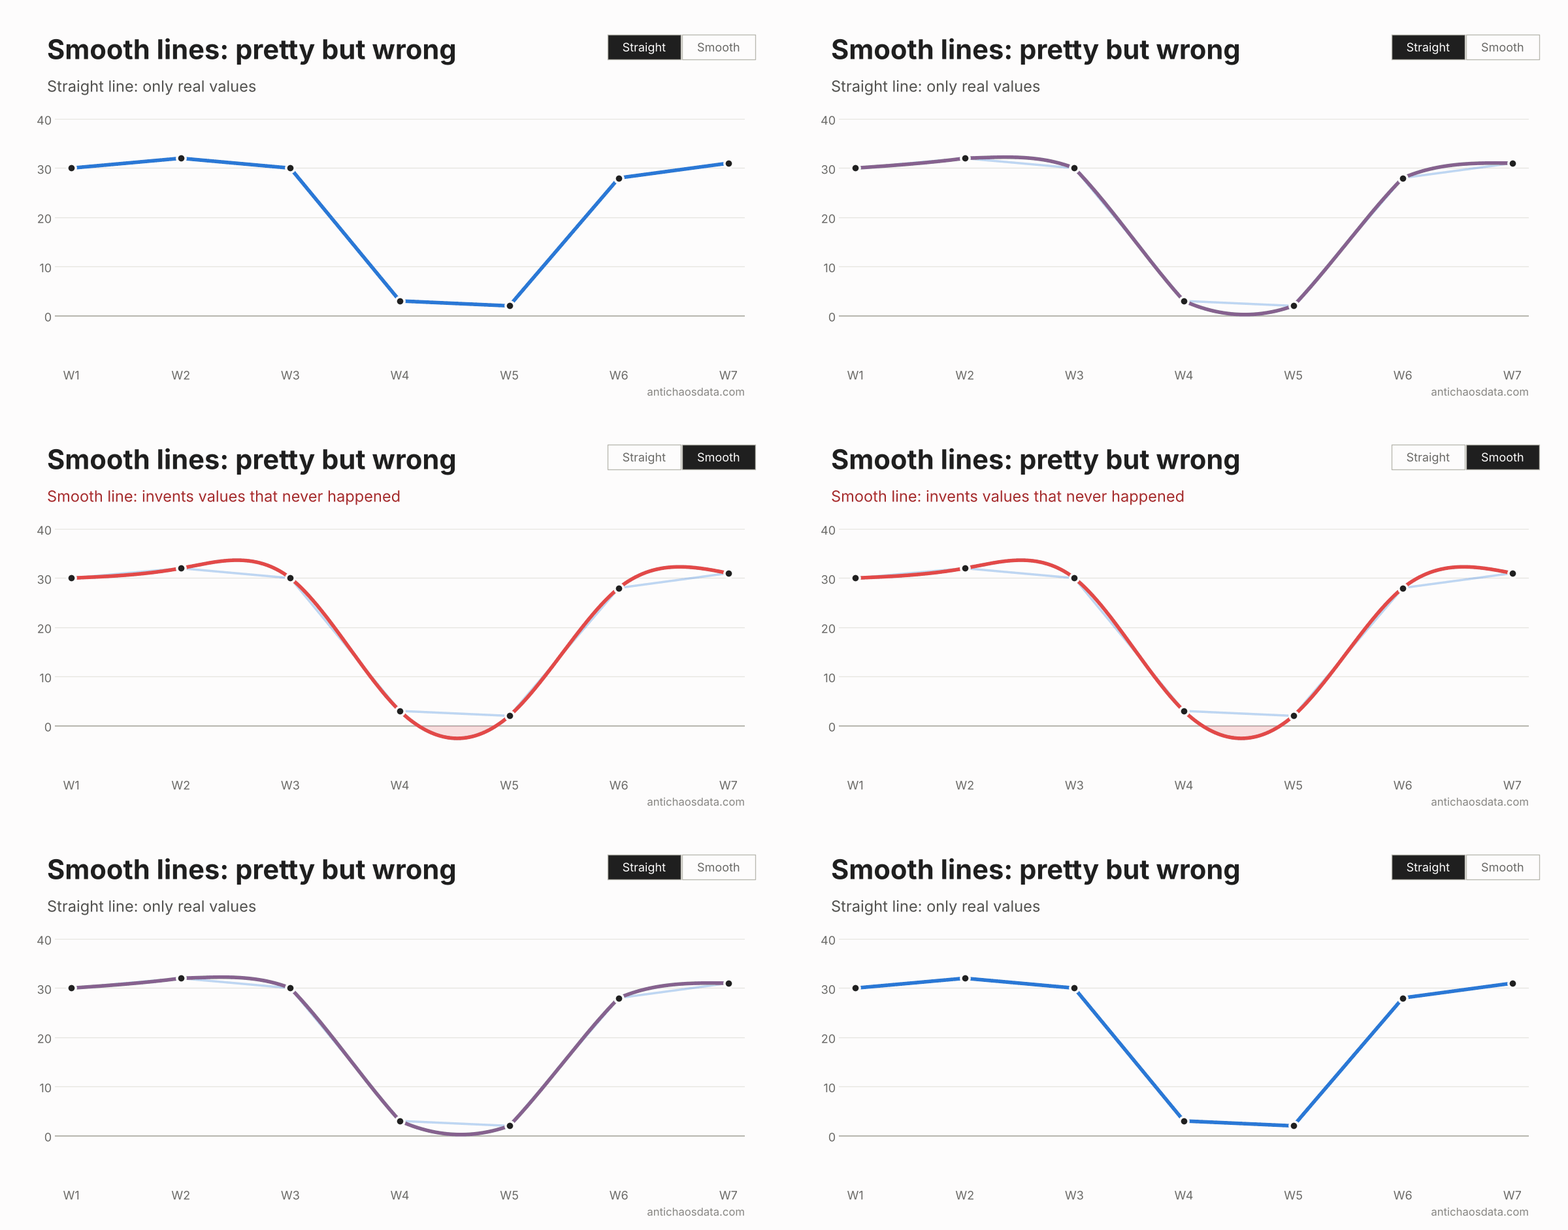
A smoothed line doesn’t just connect your data points, it invents everything in between. Here are three examples, each with the same data, and what to use instead.
1. The curve invents values that are impossible
Take seven weeks of orders: 30, 32, 30, 3, 2, 28 and 31. Two quiet weeks, then back to normal. To pass smoothly through the dip, the curve swings below zero between week 4 and 5, to −2.7 orders. On the way up it overshoots too: it peaks at 33.7 between week 2 and 3, while the best (real) week had 32.
Weekly orders
Two quiet weeks in a row
The curve dips to −2.7 orders between week 4 and 5, and peaks at 33.7, higher than any real week.
Every value on the line lies between two real data points.
A negative number of orders is not possible, but anyone reading the chart sees a line below zero, and some peaks that never occurred.
2. A running total that goes down
Cumulative measures like running totals, installed base and total customers can only go up or stay flat – that is their nature. Here the total stays at 100 for three months, jumps to 520 in April, stays at 520 in May and reaches 530 in June.
Cumulative customers
A running total can never go down
The total appears to drop to 54 between February and March, overshoots to 565, then drops again.
Flat where nothing changed, and up on new customers. The line should never go down.
The smooth curve rises to 115 before February, then drops to 54 between February and March, almost halving a total that never changed. After the jump it overshoots to 565, then dips to 508 between May and June, below the real May value. These are three moment where a number that never can decrease still do that – just be selecting the wrong data visualization.
3. Sudden changes which look gradual
Monthly sales are stable at around 100 until a price rise on 1 April, when they drop straight to 60 and stay there: 100, 102, 101, 60, 58 and 59.
Monthly sales
Price rise on 1 April
The decline seems to start between February and March, with a bump to 106 and a dip to 55 – which never happened.
Sales were even until the price rise, then dropped at once. The step line shows exactly when things changed.
The smooth curve tells a different story. It climbs to 106 between February and March, higher than any (real) month, and starts declining from there, long before the price rise. A sudden drop now looks like a gradual slide, as if customers were already leaving. After April it dips to 55, below the real low of 58.
If you use a chart like this to link an event to its effect, the smooth line points you in the wrong direction. A step line shows what actually happened: a value holds until the next one replaces it.
Conclusion
The problem is the same in every example. A smooth line is a wrong interpolation, which fills the space between the data points and suggests values that were never there. Straight lines (sloped or step lines), are the most honest interpolation.
The only time smoothing might be OK is when the underlying data is genuinely continuous and densely sampled, like a sensor reading. But with a dataset like that, the points are so close together that smoothing hardly changes the line anyway.
So just stick to the old and boring straight lines.