• Skip to primary navigation
  • Skip to main content
  • Skip to primary sidebar
Antichaos

Antichaos

Data Visualisation, Tableau & Data Services

  • Home
  • Services
    • Data Analysis
    • Training
    • Portfolio
  • Blog
  • Extensions
    • Tally
    • Latch
    • How to install
  • Tutorials
  • About Johan
  • Contact
  • Nederlands
  • Show Search
Hide Search

Best Practice

Stop using red vs green in dashboards

2026-09-15 by Johan de Groot

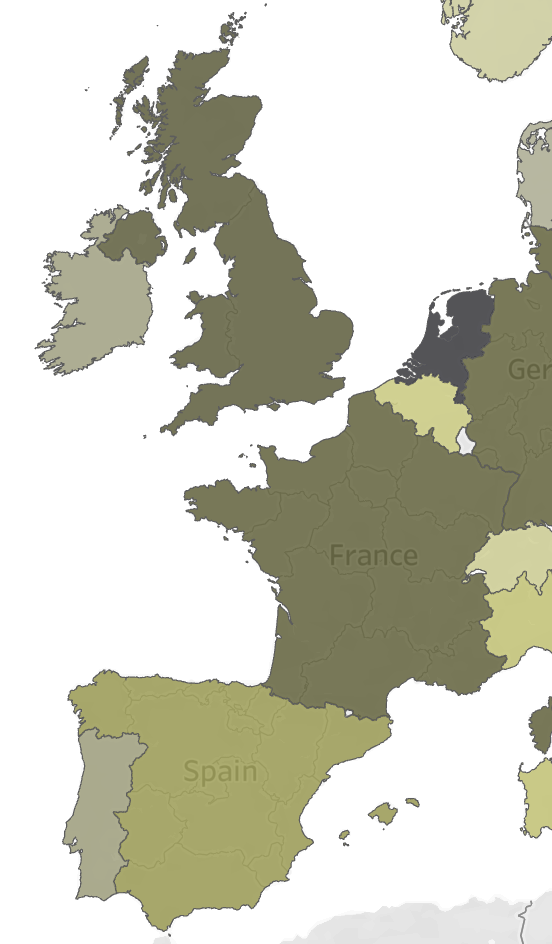
So many dashboards show “good vs bad”, or “above vs below target” in a chart or text with green and red. Red means stop, green means go in traffic – so it feels universal. It isn’t.
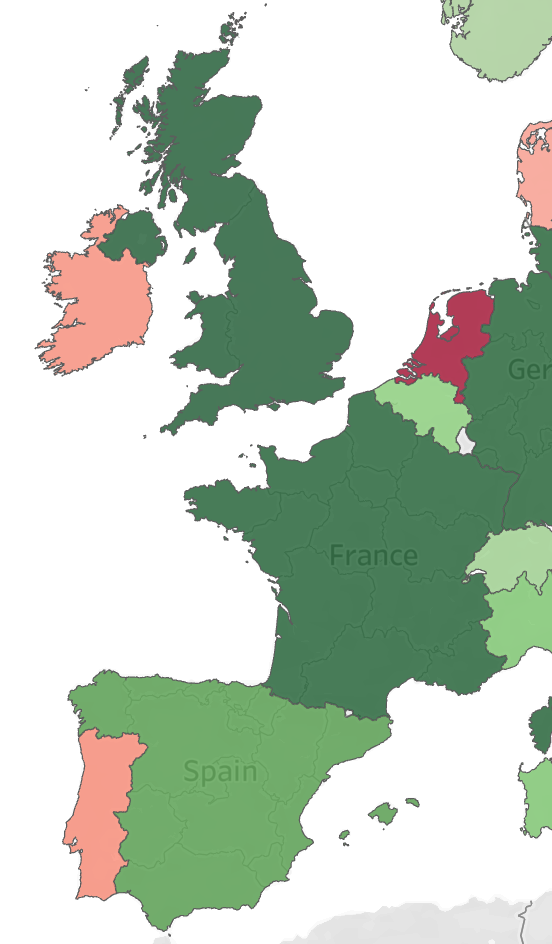
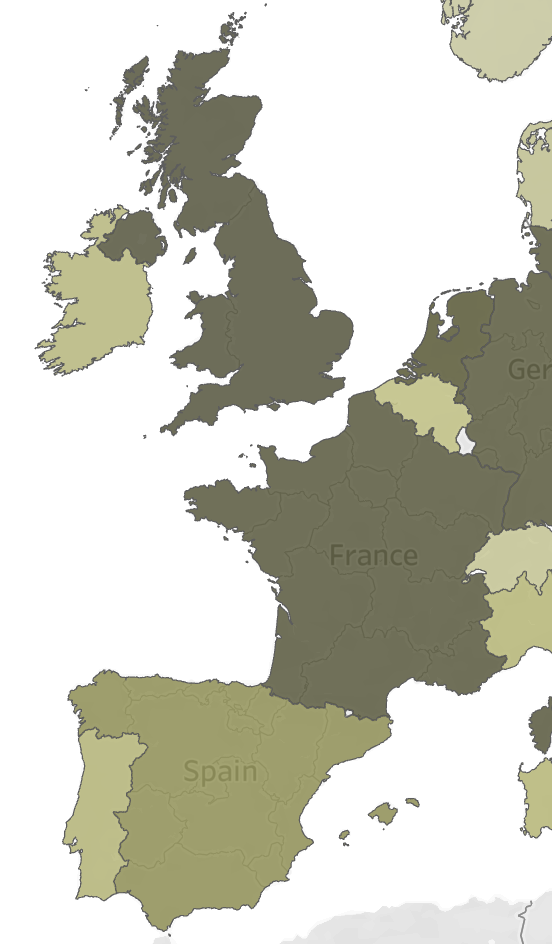
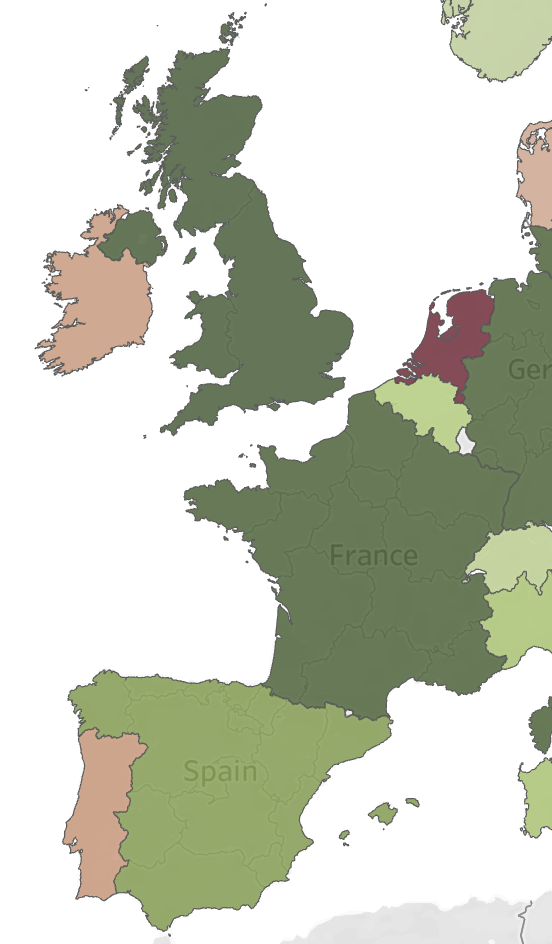
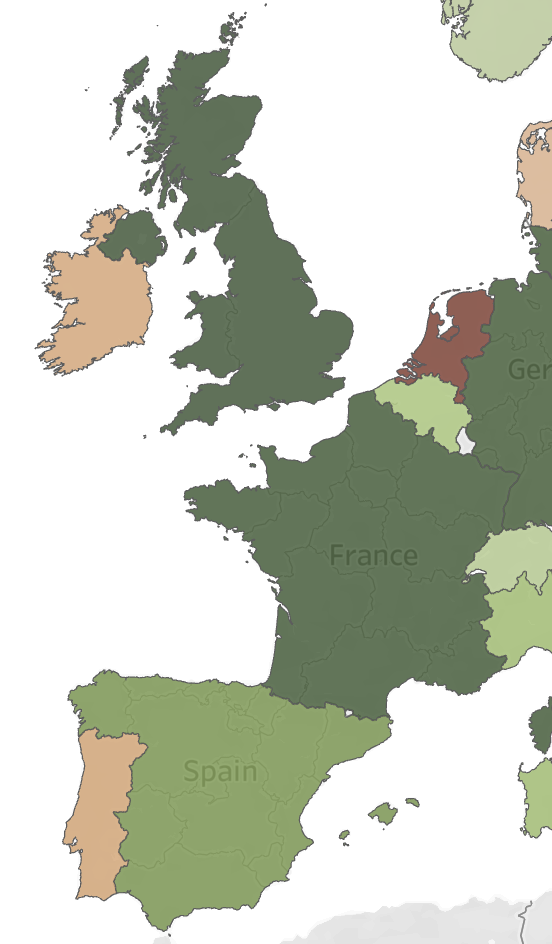
Normal
Normal
Protanopia
Prota-nopia
Deuteranopia
Deuter-anopia
Protanomaly
Prota-nomaly
Deuteranomaly
Deuter-anomaly

A meaningful part of your users find it really hard to tell apart red and green, which makes this the one of the most common accessibility mistakes in dashboard design.

[Read more…] about Stop using red vs green in dashboards

Primary Sidebar

Antichaos Services

  • Need Tableau Help ?
  • Basic, Advanced and Custom Training

Recent Blogposts

  • Stop using red vs green in dashboards
  • Tableau Toggle Button: 3 Ways to Build an On/Off Switch
  • The Tally extension: CountTo renewed
  • 5 more Tableau Desktop Tips: Fields, Calculations & Pills
  • MeasureCamp Amsterdam 2026: the power of the blank board
  • Datafam Day 2026 – Amsterdam
  • How to create pill-style navigation in Tableau
  • Tableau Visionary 2026
  • Tableau REST API Connector: Add Live Web Data to Your Dashboards
  • Rounded Corner Maps in Tableau

Follow & Connect on

Antichaos

Copyright © 2026 Antichaos

  • Antichaos
  • Blog
  • Tutorials
  • Privacy
  • Extensions
  • Contact