
• Skip to primary navigation
  • Skip to main content
  • Skip to primary sidebar
Antichaos

Antichaos

Data Visualisation, Tableau & Data Services

  • Home
  • Services
    • Data Analysis
    • Training
    • Portfolio
  • Blog
  • About Johan
  • Contact
  • Nederlands
  • Show Search
Hide Search
Home » Blog » Rounded Corner Maps in Tableau

Rounded Corner Maps in Tableau

2026-03-05 by Johan de Groot

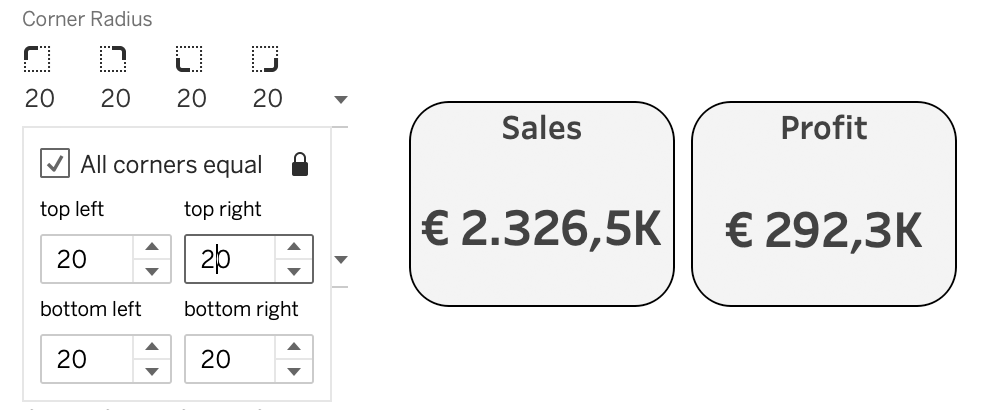
Version 2026.1 of Tableau is released with – among other features and improvements – Rounded Corners! A long awaited feature by many, with some doubts on the necessity by others…

According to the New Features list:

Set a corner radius for dashboard objects directly in Tableau Desktop and Web Authoring. Say goodbye to jumping through hoops with annotations or images. Just set the radius value to create a simple rounded corner or a more extreme corner radius to create different shapes.

Creative Use

Besides the obvious use-case of ‘widgets’ with rounded corners this new formatting feature has some more possibilities.
As with any new Tableau feature, it’s fascinating to see the creative ways the community pushes its boundaries.

For me, this update provided a straightforward way to execute an admittedly niche concept that was previously a headache to build: a map featuring a functional magnifying loupe for zooming in on details. Standard square maps can feel ‘boxy’; rounded corners give your dashboard a modern, app-like aesthetic.

This is my quickly setup visualization

If you are interested how this is setup, just download the workbook from Tableau Public and analyze the file.

Get more out of your data?

I'm Johan - freelance data consultant behind Antichaos Data. I help you get Tableau and data work into shape: full projects, interim support, performance tuning, dashboard redesigns, training, or just an extra pair of hands when you're stuck.

Get in touch

Tableau

Primary Sidebar

Antichaos Services

  • Need Tableau Help ?
  • Basic, Advanced and Custom Training

Recent Blogposts

  • The Tally extension: CountTo renewed
  • 5 more Tableau Desktop Tips: Fields, Calculations & Pills
  • MeasureCamp Amsterdam 2026: the power of the blank board
  • Datafam Day 2026 – Amsterdam
  • How to create pill-style navigation in Tableau
  • Tableau Visionary 2026
  • Tableau REST API Connector: Add Live Web Data to Your Dashboards
  • Rounded Corner Maps in Tableau
  • Improving Radar Charts: Showing Overview and Details
  • Create a Radarchart in Tableau – Modular and Simple

Follow & Connect on

Antichaos

Copyright © 2026 Antichaos

  • Antichaos
  • Privacy
  • Contact