
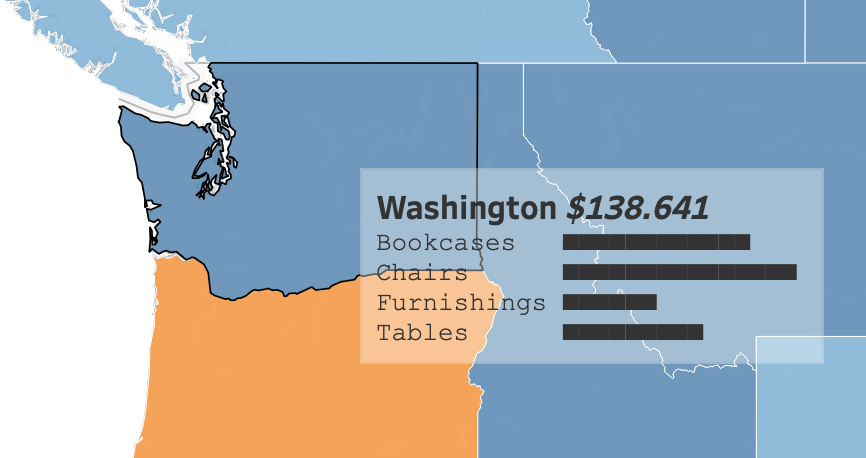
Tooltips are extremely useful – but can distract from other data. The bigger they are, the more they hide. A solid white box sits right on top of the data you’re trying to explain.
Tableau 2026.3 has a solution for that. It’s one of the few new features in what is likely the last Desktop release before Tableau Studio takes over: you can now set the background color and transparency of your tooltips.
How to use it
Nobody would blame you if you haven’t noticed it yet, because it’s implemented quite subtly. The Tooltip dialog now has a background color option in the toolbar.
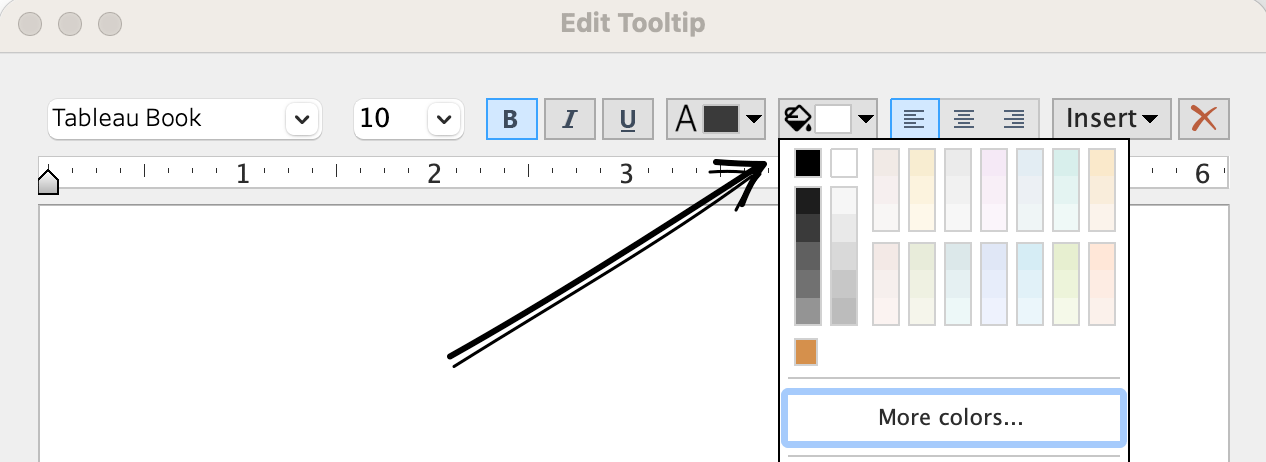
- Open the tooltip editor: Marks card > Tooltip.
- Click the new background color option in the toolbar.
- Pick a color from the palette, or choose More colors… for a custom one.
- Set the opacity anywhere from 0% (fully transparent) to 100% (solid).
The feature is called “Transparent Tooltips”, but it does more than that. You can also replace the default white background with any color you like.
Why it is useful
It’s definitely not the most requested feature, but it can be very useful. Several people have already told me it will improve their dashboards, especially when they use large tooltips that would otherwise hide the very data they describe.
Using semi-transparency keeps the map underneath visible. Play with both the font and background colors to get the best contrast.
Stylish colors
Instead of the standard white, you can now get more creative with background colors, especially semi-transparent ones:
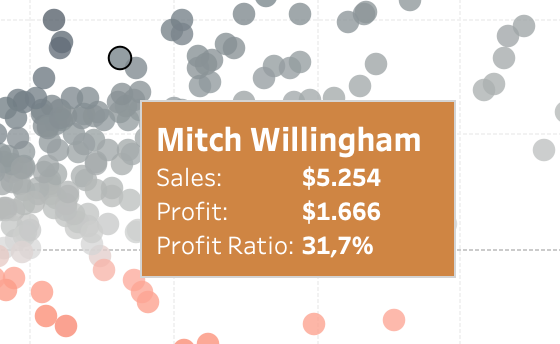
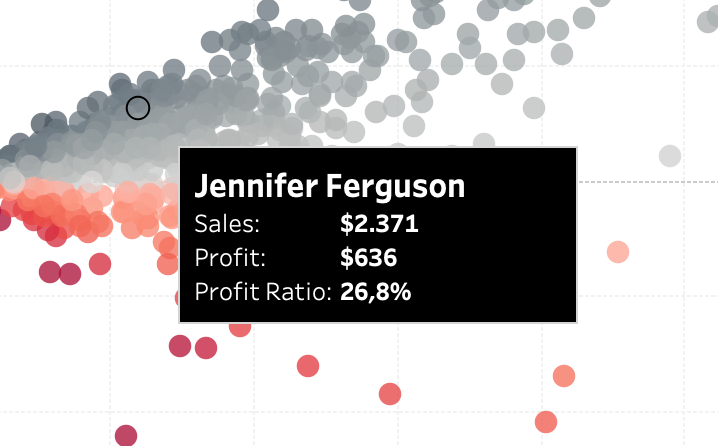
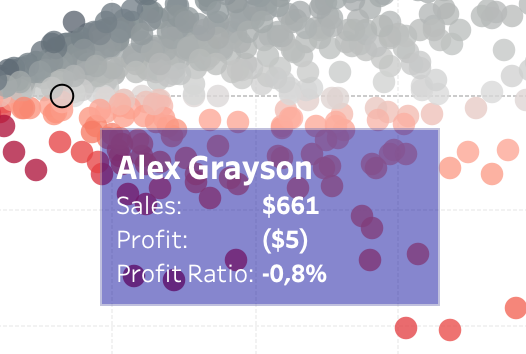
Function and accessibility over style!
A semi-transparent tooltip over many marks can make text hard to read. Keep the opacity high enough (low transparency) that the text stands out clearly, and test with the densest part of your viz. A darker background with white text often holds up better than a light one.
Viz in Tooltip is not transparent…
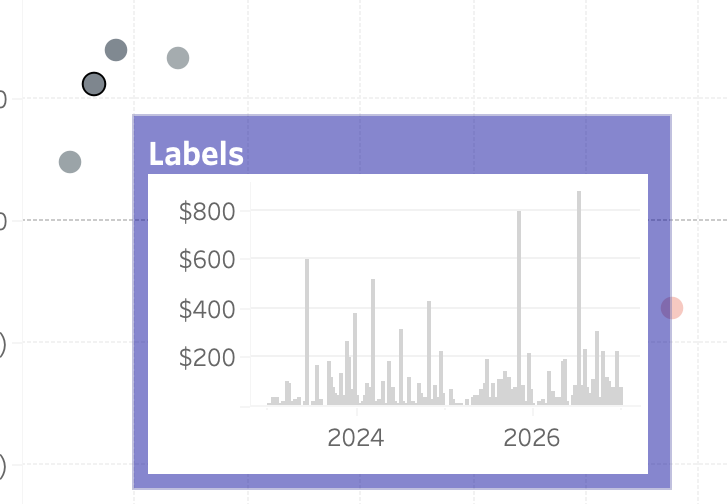
Unfortunately, Viz in Tooltip doesn’t benefit from this. The embedded viz is still rendered as an image, with no transparency options.
… so be creative!
If you want a small transparent chart as a tooltip, you can create your own using text.
To build bars like the ones in the video above, use a calculated field that repeats a Unicode block character (█). Solid blocks show each sub-category’s share of the state’s sales; dotted blocks (░) fill the rest of the bar.
"Bookcases     " +
REPLACE(SPACE(INT(ROUND(20 * SUM(IF [Sub-Category] = "Bookcases" THEN [Sales] END) / SUM([Sales]), 0))), " ", "█")
+
REPLACE(SPACE(20 - INT(ROUND(20 * SUM(IF [Sub-Category] = "Bookcases" THEN [Sales] END) / SUM([Sales]), 0))), " ", "░")
+ "
"
+ "Chairs        " + …   // repeat for each sub-category
Use a monospace font (such as Courier New) for the labels, so the bars line up. Let your inner ASCII artist loose!
Wrapping up
Transparent and colored tooltips are a small feature that few people asked for, but they give you one more way to make a dashboard feel “designed” rather than default. Use them carefully, keep the text readable – and they will make tooltips less intrusive.